Bitcoin Roars Back: Is a New All-Time High Imminent?

Bitcoin's bulls are charging again—and this time, they smell blood in the water. After months of sideways action, the king of crypto is flirting with levels not seen since its last euphoric peak. Could ATH be the next stop?
Here's why traders are stacking sats like there's no tomorrow.
The Setup: A Perfect Storm for Bitcoin
Macro tides are turning. Inflation data cools, ETFs hoover up supply, and Wall Street's old guard suddenly remembers how to spell 'HODL.' Meanwhile, retail FOMO lurks just offstage—always one Coinbase outage away from chaos.
The Technicals: Breaking Walls of Worry
Key resistance levels crumple like a DeFi project's tokenomics paper. The 200-week moving average? Obliterated. Fibonacci extensions? Treated like suggestions. Every dip gets bought faster than a VC's seed round.
The Wildcards: Black Swans or Golden Geese?
Regulators sharpen their knives (as usual), while Tether's printers work overtime (also as usual). But this cycle's secret weapon? The army of diamond-handed millennials who now outnumber Boomers—and couldn't care less about 'risk-adjusted returns.'
One thing's certain: if Bitcoin punches through its previous high, the resulting frenzy will make 2021 look like a test net. Just don't tell the SEC—they're still drawing up warnings about the dangers of financial sovereignty.
Bitcoin (BTC): Trying to be bullish again
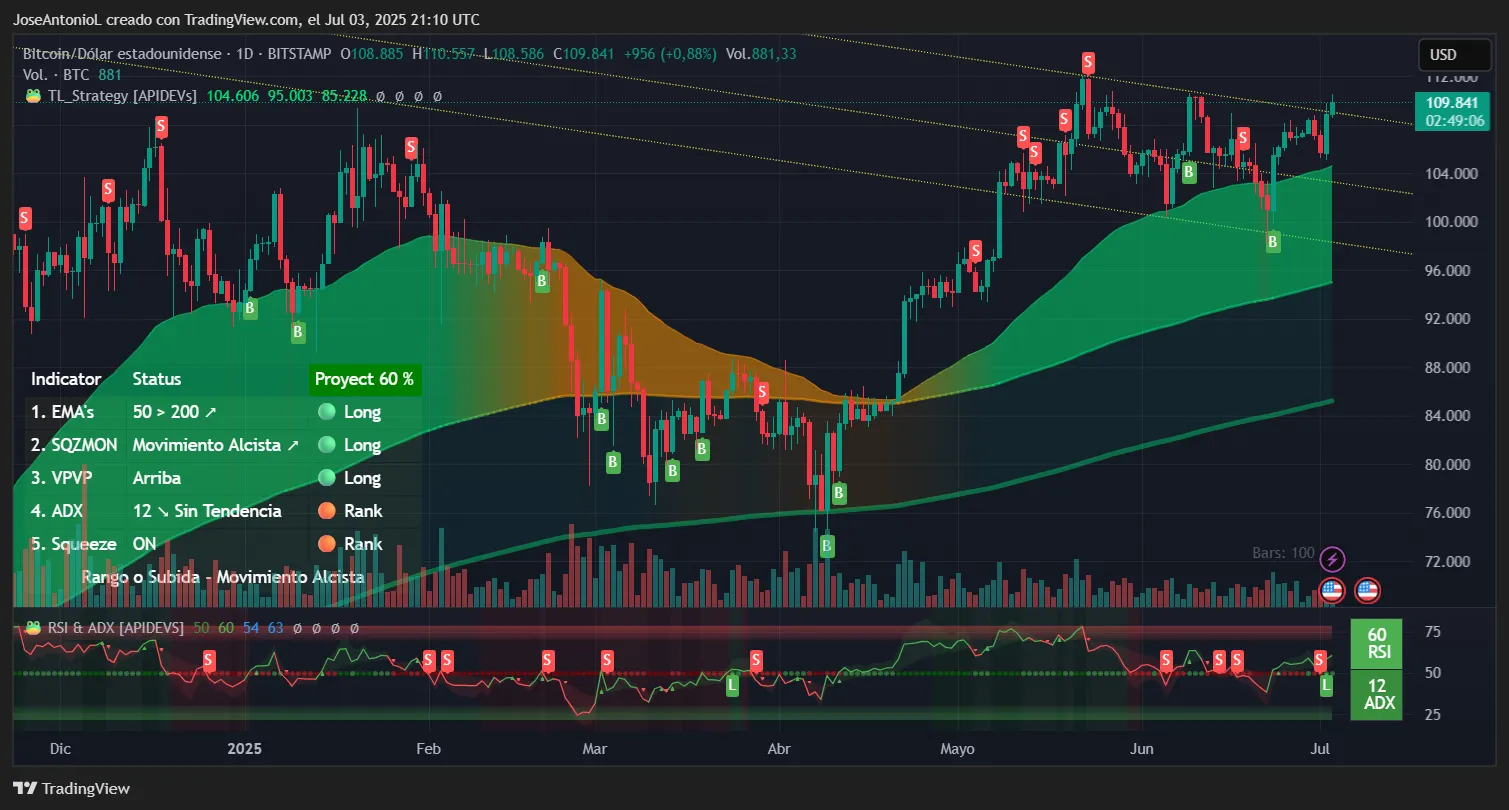
Bitcoin's daily gain to its current price of $109,781 represents measured strength rather than explosive momentum, with the flagship cryptocurrency consolidating near recent highs after briefly topping $110,500. That said, as small as today’s movement is, it was enough to make prices break the resistance of a bearish channel (yellow lines) that has been in place since the last 39 days—the day it set the current all-time high mark of $111,814.
The daily chart reveals a market in delicate balance. The Relative Strength Index (RSI) at 60 indicates healthy bullish momentum without approaching overbought territory above 70. This reading suggests Bitcoin has room to run higher before facing selling pressure from profit-taking. Traders typically view RSI readings between 50-70 as the "sweet spot" for sustained uptrends, and breaking a bearish channel at such healthy levels is good for those expecting momentum.
The Average Directional Index (ADX) at 12 tells a more nuanced story. ADX measures trend strength regardless of direction—readings below 20 indicate a weak or non-existent trend, while values above 25 confirm strong directional movement. Bitcoin's current ADX suggests the market is in a consolidation phase, with neither bulls nor bears holding decisive control. This often precedes significant moves as the market coils for a breakout.
This is, of course, to be expected. Even the current bearish correction has a very light incline, and a MOVE over the resistance in the short term cancels part of the bearish strength—not enough to say the coin is short-term bullish, but interesting to consider alongside other indicators.
The exponential moving averages paint a definitively bullish picture, especially for traders with longer time frames in mind, with the 50-day EMA positioned above the 200-day EMA. This configuration typically signals sustained buying pressure and healthy market structure. When shorter-term averages stay above longer-term ones, it indicates that recent buyers are willing to pay higher prices than historical averages.
The Squeeze Momentum Indicator showing "On" status suggests volatility compression is occurring. Think of this as a spring being coiled—when the squeeze releases, it often results in explosive price movement in either direction.
In other words, there is still potential for a continuation of the bearish trend, but it is likely to see a big movement shortly as prices try to break from this zone
Ethereum (ETH): Breaking free despite technical headwinds
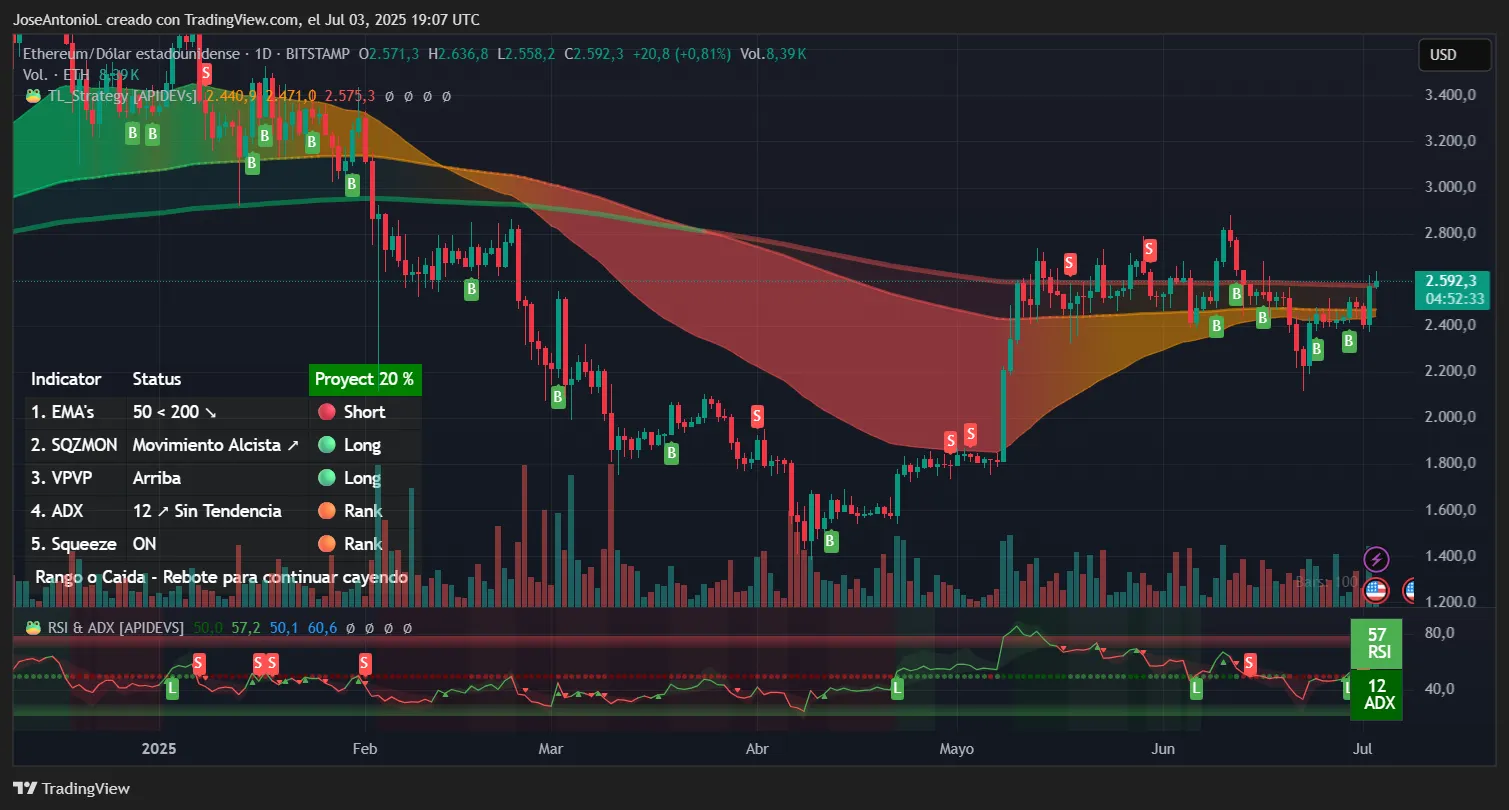
Ethereum is slightly up today, with a small movement to its current price of $2,592 that comes after a jump yesterday that recovered prices from daily lows of $2,374.
The RSI at 57 places Ethereum in neutral territory. This middle-ground reading often indicates a market in transition, where the previous trend (bearish in this case) may be losing steam. For traders, this suggests ETH could be building a base for further upside without the immediate risk of a sharp pullback that typically accompanies overbought conditions.
The ADX reading of 12 mirrors Bitcoin's weak trend strength, indicating Ethereum is also in a consolidation phase. However, this low ADX after a strong move up could be interpreted as the market digesting gains before the next leg higher. When ADX readings remain below 20 after significant price movement, it often signals accumulation by smart money.
The concerning technical factor is the "death cross" formation visible on the chart—the 50-day EMA sitting below the 200-day EMA, and the inability of traders to FORM a golden cross despite both EMAs being so close to each other. This bearish configuration typically indicates that selling pressure has dominated recent trading. However, today's price action despite this headwind suggests buyers are stepping in with conviction, potentially setting up for a bullish crossover if momentum continues.
The Squeeze Momentum Indicator showing "On" status, combined with today's breakout move, suggests Ethereum may be in the early stages of a volatility expansion phase. When prices break higher while the squeeze is active, it often leads to sustained trending moves.
Edited by Andrew Hayward
