Bitcoin Roars Back as Crypto Markets Explode in Green: What’s the Next Price Target?

Bitcoin stages massive comeback as digital asset markets flip bullish overnight
The Rebound Rally
Bitcoin surged past resistance levels as crypto markets painted trading screens green across the board. The flagship cryptocurrency's bounce caught short sellers off guard, triggering a cascade of liquidations that fueled the upward momentum.
Market Mechanics in Motion
Trading volumes spiked 40% during the rally as institutional and retail investors piled back into digital assets. The fear and greed index swung from extreme fear to greed territory in under 24 hours—because nothing says stable market like emotional whiplash.
Technical Breakthrough
BTC smashed through multiple resistance zones, clearing the path for potential new highs. The move validated key support levels and demonstrated the asset's resilience despite recent regulatory headwinds and banker skepticism.
Where Next for Prices?
Traders now eye the next psychological barriers as momentum builds. The rally's sustainability hinges on maintaining current volume levels and avoiding the classic crypto pattern of pump-and-regret. Because if there's one thing more predictable than Bitcoin's volatility, it's Wall Street analysts claiming they saw it coming all along.
Bitcoin (BTC) price: Bulls keeping the faith
Bitcoin has staged a measured recovery, gaining 1.85% to close at $113,985 after opening the day at $111,923. The flagship cryptocurrency briefly touched $114,309—representing a 2.2% intraday peak—before settling just below that resistance level.
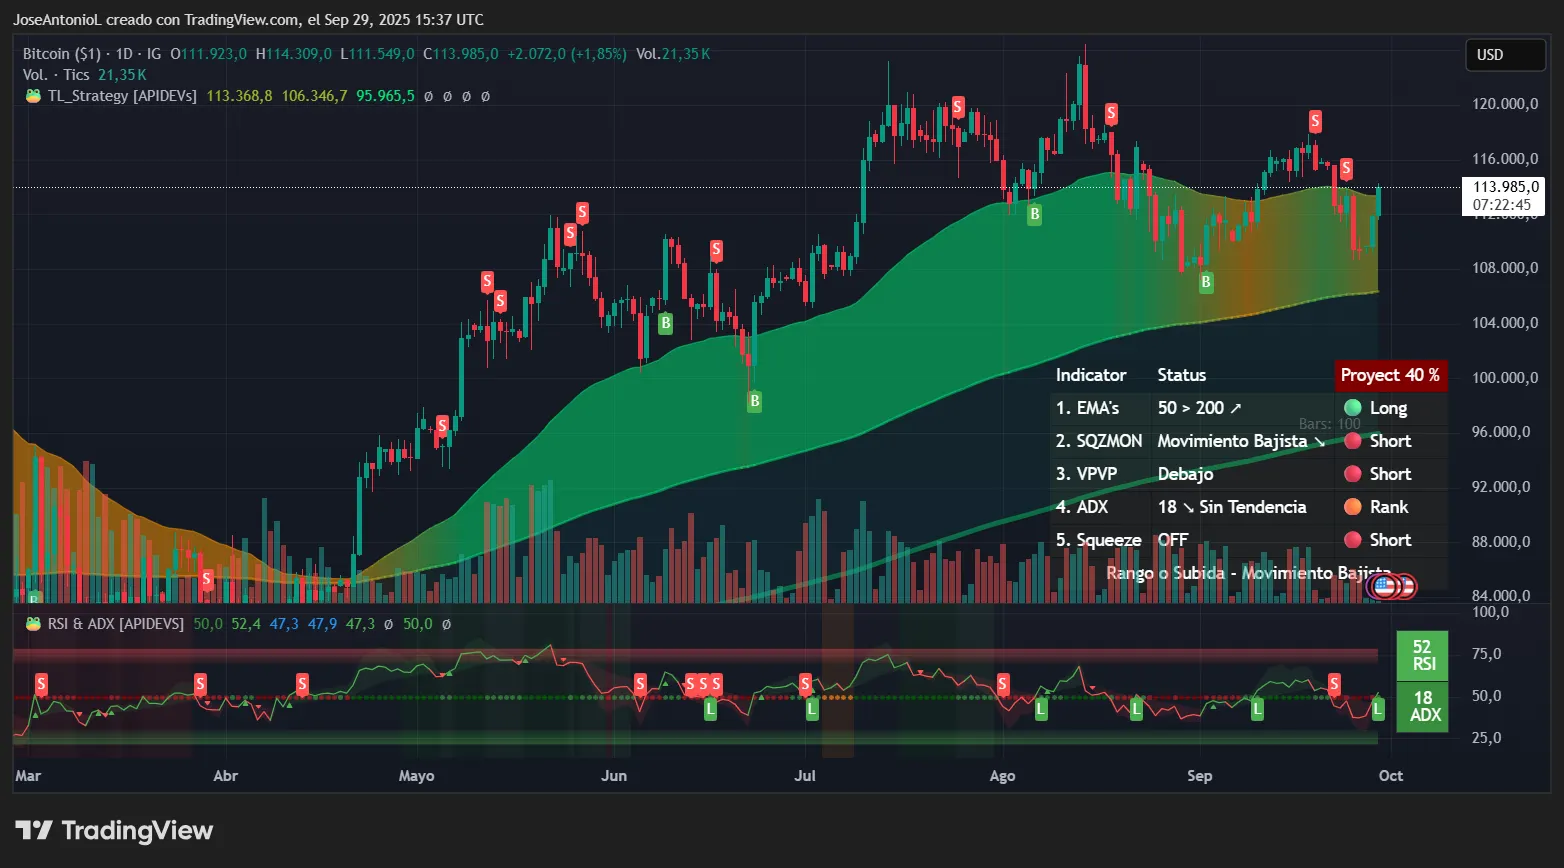
On the technical front, however, Bitcoin's indicators paint a picture of consolidation rather than conviction.
The Relative Strength Index, or RSI, for BTC is at 52, which sits dead center in neutral territory. This reading tells traders that neither bulls nor bears have decisive control. Think of RSI like a tug-of-war rope; at 50, it's perfectly balanced. Readings above 70 signal the bulls might be exhausted (overbought), while below 30 suggests bears have overdone it (oversold). At 52, it shows that bulls have wrestled control away from bears—but only slightly—bringing the coin back up from oversold territory.
The Average Directional Index, or ADX, measures trend strength on a scale where anything below 20 means "no clear trend," 20-25 indicates a trend is forming, and above 25 confirms strong directional movement. At 18, bitcoin is essentially drifting in a choppy market where neither buying nor selling pressure dominates. This is why you don’t see a clear long-term bullish or bearish trend, and instead the coin has been bouncing sideways for weeks now.
The one bright spot comes from the exponential moving averages or EMAs. These averages give traders a sense of price supports and resistances over short, medium, and long time frames.
At the moment, Bitcoin’s 50-day EMA is trading above the 200-day EMA (visible as the green zone on the chart). This looks good for bulls, since it demonstrates that the average price of Bitcoin over the short term is trading higher than the average price over the long term. But it’s important to note: The gap between these EMAs is closing, reflecting the fact that the price of Bitcoin has been slowly going down more recently and may enter a “death cross” formation in the future unless something changes.
A “death cross” in trading is when the EMA50 (the average price of the last 50 days, or the short-term movement) crosses below the EMA200 (the average price of the last 200 days). Traders read it as increased downside risk and may reduce long exposure or look for short setups, especially if the price stays beneath both EMAs and volume picks up. It is essentially the opposite of a “golden cross” setup, in trader speak, and generally considered a bearish sign.
On Myriad—a prediction market built by Decrypt’s parent company Dastan—traders have placed the odds at 46% that Bitcoin sooner hits $125K than $105K. This market, which has been active since early July, provides a gauge of aggregated sentiment for Bitcoin among these prediction market users.
Less than two weeks ago, these odds were completely reversed, with bettors giving BTC a 71% chance of hitting $125K as recently as September 18. The odds now narrowing reflects the market’s cautious stance despite today's gains. Seems like not even a 5% bounce to the price of Bitcoin is enough to make these predictors bullish again.
Solana (SOL) price: Quiet confidence builds
Solana's more modest 0.30% gain to $211.58 might seem underwhelming compared to Bitcoin's move, but the technical setup suggests accumulation beneath the surface.
Over the last 24 hours, solana is up 3.5%, making it the best performing asset in the top 10 by market cap.
After opening at $210.95, SOL touched $213.58 (a 1.2% intraday spike) before consolidating around the $211 mark—enough to hold above a $113 billion market capitalization.
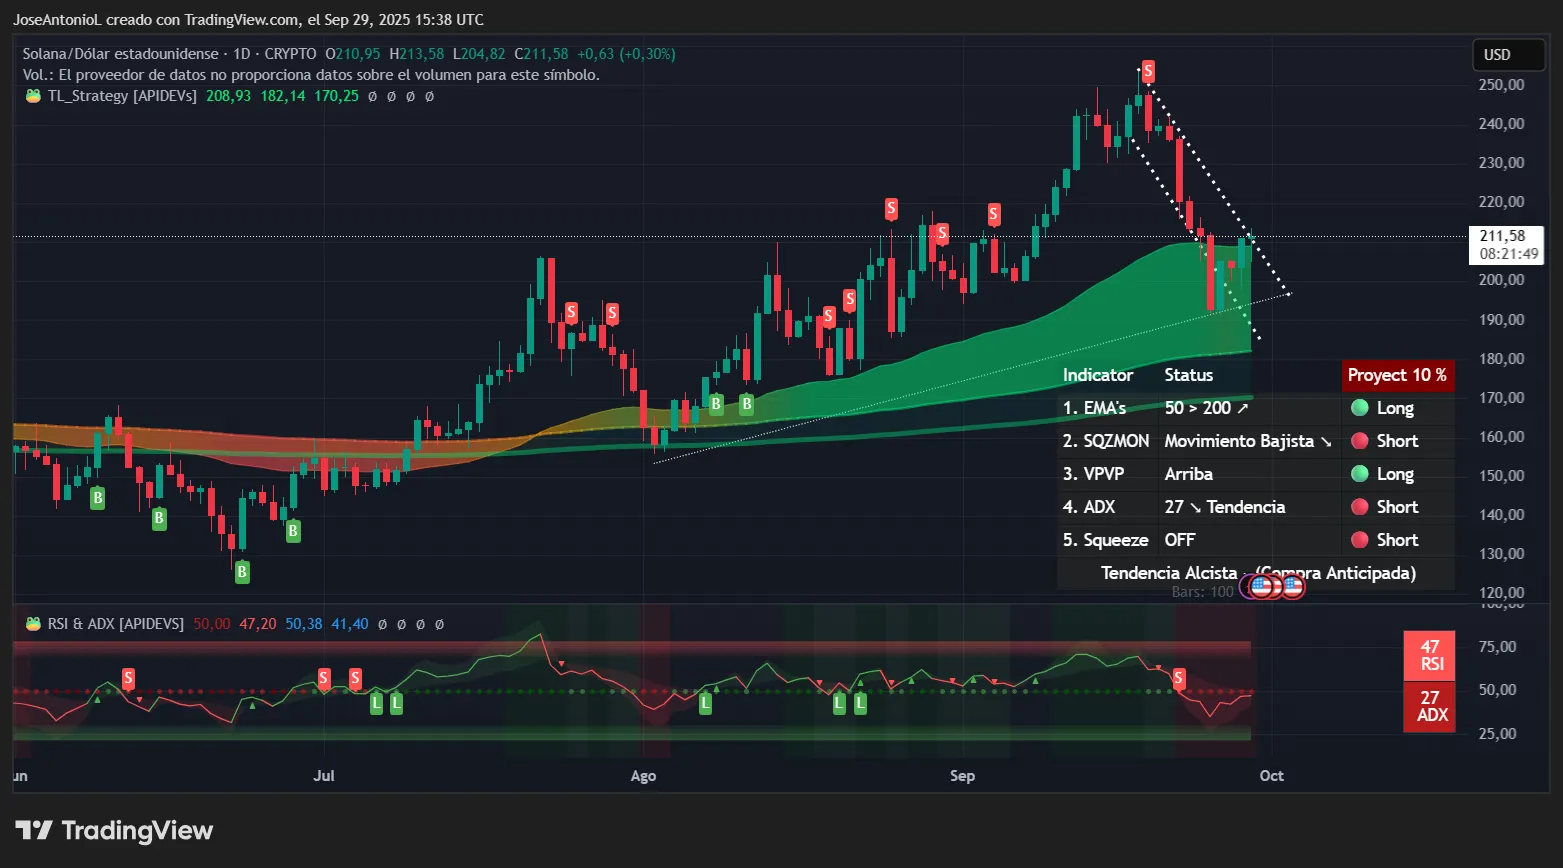
The RSI at 47 places SOL slightly in bearish territory. After violent swings in recent weeks, this middling RSI could be interpreted by traders as healthy consolidation, especially considering it’s now on the upswing after a heavy dip last week. Solana tested the resistance of a short-term bearish channel, which had been in place throughout the entire month.
The ADX at 27 combined with price holding above both the 50-day and 200-day EMAs, suggests bulls maintain control despite today's modest gains. When ADX is above 25, day traders often increase position sizes as trends tend to persist. The prices are once again trading on top of the EMA50, which is also a good sign for short-term bulls.
The upcoming SEC decisions on Solana ETF applications, with deadlines starting next month, could serve as that catalyst, with Bloomberg analysts estimating a 90% approval chance. This regulatory clarity could unlock institutional flows similar to what Bitcoin experienced post-ETF approval.
Once again, as with predictions on Bitcoin, users on Myriad aren’t yet feeling the bullish vibes. Myriad predictions place the odds at just 40% that Solana hits a new all-time high price this year above $294. That’s a sharp fall from 65% odds of a new SOL all-time high just over a week ago.
Disclaimer
The views and opinions expressed by the author are for informational purposes only and do not constitute financial, investment, or other advice.
