Crypto Market Defies Sea of Red and Mounting Fear as HYPE Token Surges Against the Tide

Digital assets bleed across the board while one token laughs at gravity.
THE BLOODBATH
Bitcoin leads the plunge with a 7% nosedive, dragging Ethereum down 9% in its wake. Altcoins get slaughtered even harder—Solana tumbles 12% as traders flee riskier bets. Market cap evaporates by $180 billion in 24 hours, triggering liquidations worth $650 million. Fear & Greed Index hits 'Extreme Fear' levels not seen since the FTX collapse.
THE ANOMALY
HYPE token rockets 42% while everything else crumbles. Defies the market dump with zero fundamental news—just pure meme energy and coordinated buying. Trading volume spikes 800% as degenerates chase the green candle in a red ocean. Outperforms every major asset class including gold and tech stocks.
WHY IT MATTERS
Shows crypto's dual personality: institutional bloodbath meets retail rebellion. Traders rotate from 'serious' projects to pure momentum plays when markets break. Proves narratives still overpower fundamentals during panic cycles. Wall Street analysts scramble to explain the move while crypto natives shrug—'number go up' still trumps PowerPoint presentations.
THE AFTERSHOCK
Regulators already drafting memos about 'irrational exuberance' (because they totally saw this coming). Bitcoin maximalists call it proof of market immaturity while DeFi degens screenshot their portfolios. One thing's clear—in crypto, even apocalypses have silver linings. Or as the suits would say: 'dislocated price action creating asymmetric opportunities.'
Hyperliquid price: The HYPE is back?
While its rival Aster has been stealing headlines with a jaw-dropping surge since its launch last week, Hyperliquid is quietly mounting its own comeback.
Hyperliquid is both its layer-1 blockchain network and a decentralized exchange that specializes in perpetual futures—derivatives contracts that never expire and allow crypto traders to both hedge risk and essentially bet on the future price of digital assets, such as Bitcoin.
The exchange is powered by a token of the same name, which trades as HYPE, and both the exchange and the token have experienced a rush of interest over the last several months. For context, despite the recent ups and downs, HYPE is up more than 20% in the last three months and up close to 600% in the last year, currently commanding an impressive $12.2 billion market cap.
The Hyperliquid token surged today from a low of $40.376 to its current price of $44.114, representing a 9.26% gain in a market where everything else is bleeding.
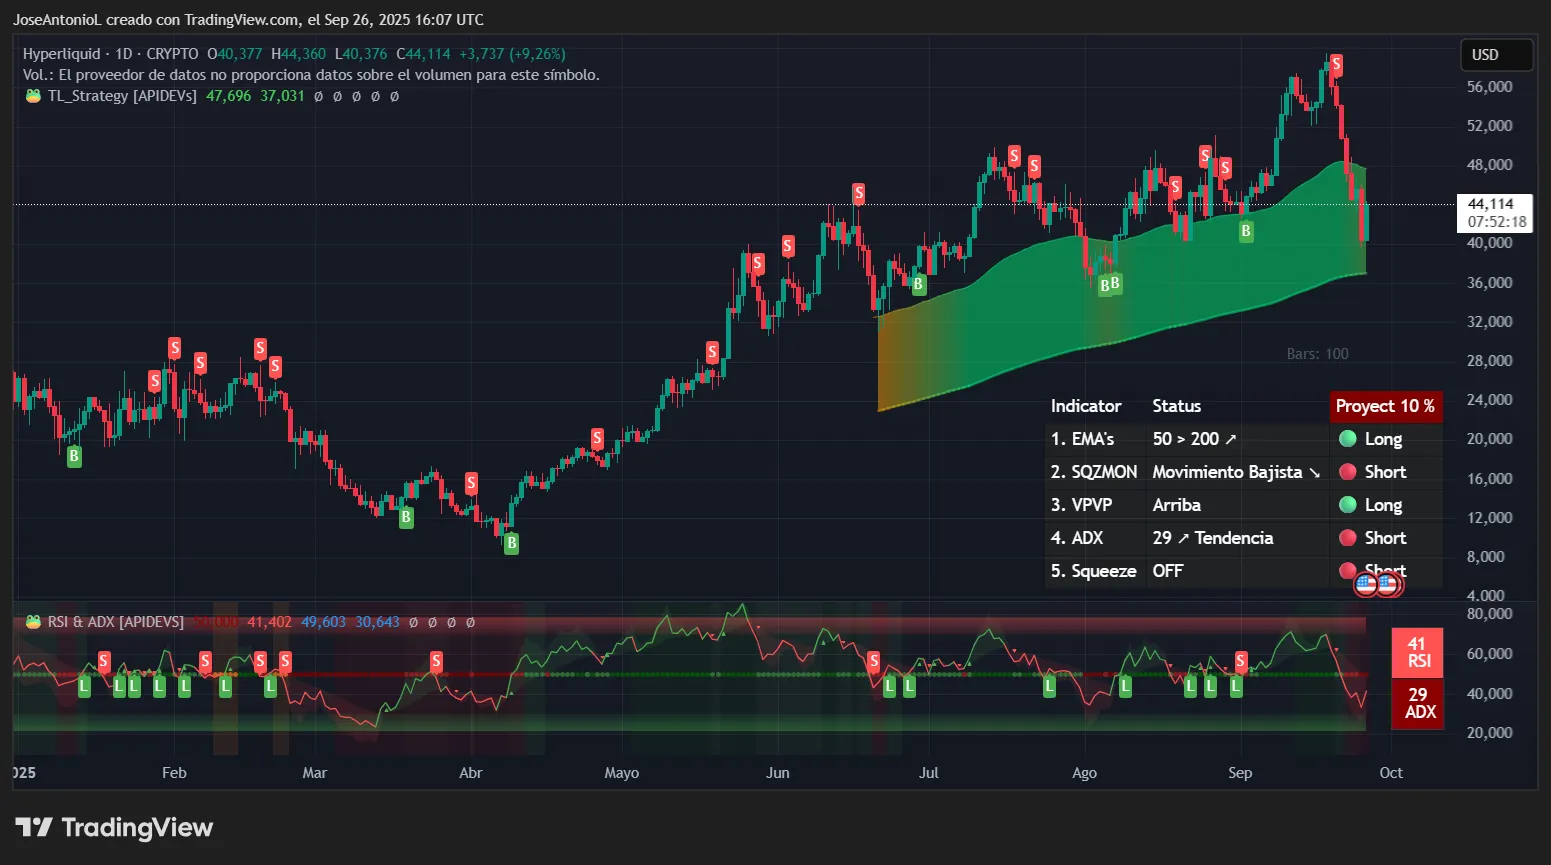
Looking at the technical breakdown, HYPE is displaying the sort of behavior that traders WOULD interpret as potentially the end of a major correction. The price of the coin, after all, is down close to 10% in the last 30 days.
The Relative Strength Index, or RSI, is one such technical indicator that traders rely on. RSI measures price momentum on a scale from 0 to 100, where readings above 70 signal overbought conditions and below 30 suggesting oversold.
Hyperliquid sits at 41—technically bearish territory, but here's what traders need to understand: After a token corrects from $56 to $40, an RSI at 41 actually signals healthy consolidation rather than weakness. This is like a reload zone where smart money accumulates before the next leg up. Traders typically see RSI readings between 30-45 after major corrections—notice the chart is still on an upwards trajectory—as buying opportunities rather than sell signals.
The Average Directional Index, or ADX, for HYPE is at 29, which shows strengthening trend momentum. ADX measures how strong a price trend is regardless of direction—readings above 25 confirm an established trend, and at 29, we're seeing HYPE break out of its consolidation phase. The major dip cooled the ADX a lot, but still wasn’t enough to wipe out the upward trend in place.
Exponential moving averages, or EMAs, give traders a sense of price resistances and supports by taking the average price of an asset over the short, medium, and long term. Hyperliquid is still a young coin, without the trading history of an asset like Bitcoin, but the EMA picture appears bullish.
At the moment, HYPE’s 50-day EMA is sitting above its 200-day EMA, meaning the average price over the short term is still higher than the average price over the long term. This configuration typically signals that short-term momentum is overpowering long-term pessimism, suggesting the path of least resistance is higher.
But as a warning sign, the gap between both EMAs is closing, which could potentially lead to a death cross formation (when the EMA50 moves below the EMA200). In this scenario, some traders may opt to set up buy orders NEAR the EMA200 for those thinking the token may continue its bearish correction before bouncing.
On Myriad, a prediction market developed by Decrypt's parent company Dastan, sentiment on HYPE hasn't yet reached the bullishness exhibited in the charts. At the moment, Myriad traders don't expect the price of HYPE to rise to $69 any time soon, placing those odds at just 30% when measured against the odds of it dropping below the $40 mark.
BNB price: Paying the price for Aster's success
The story of BNB today is a classic “sell the news” scenario, as the Binance-issued token drops 4.23% to $947.55 in the last 24 hours, making it the worst performer among the top 10 cryptocurrencies by market cap.
As discussed earlier this week on Decrypt, BNB had been on fire lately, and was on Tuesday the only coin in the top 10 by market cap in the green. Much of the price movement could be attributed to an increase in activity on the BNB network as a result of the explosive growth of Aster, a Hyperliquid competitor on the BNB Chain.
But, as we’ve seen so many times in markets: what goes up, must eventually come down. And at the moment, the, er, hype around Aster has slowed. And BNB now appears to be taking a hit as a result.
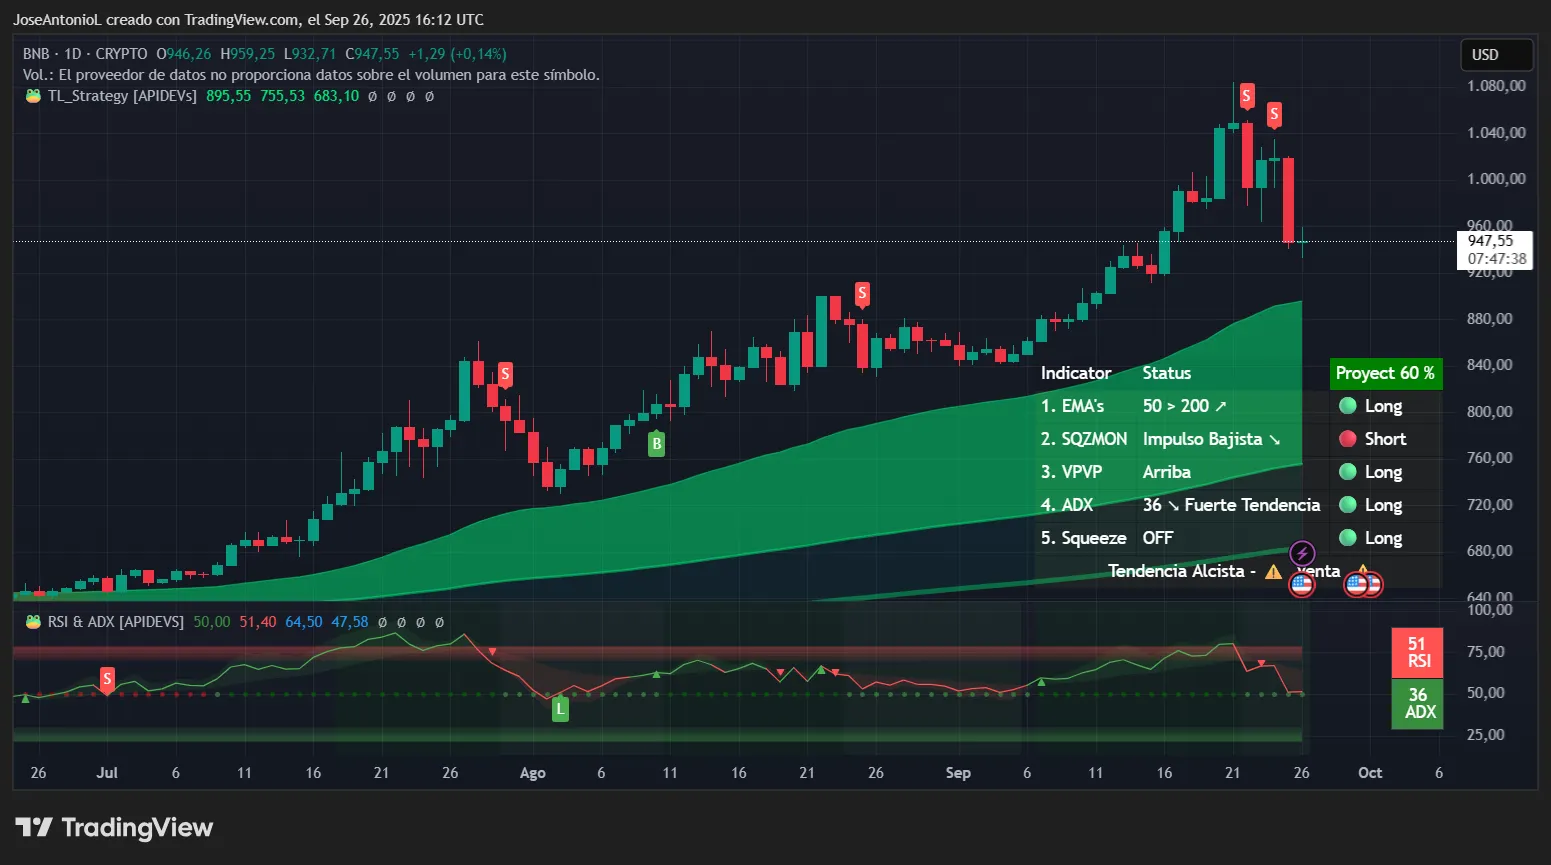
BNB’s RSI is at 51, which sits right at neutral and typically indicates a market in equilibrium waiting for the next catalyst. For traders, this dead-center reading often precedes sharp moves in either direction as the market breaks out of indecision.
The ADX at 36 confirms a strong established trend, but the Squeeze Momentum Indicator shows a bearish impulse in underway.
When ADX is high but momentum is bearish, it typically means sellers are in control and dip buyers should be cautious. This combination often results in continued pressure until ADX drops below 25, signaling trend exhaustion.
Looking at the price action on the chart, BNB opened the day around $946, reached a high near $959, but has since retreated to $947.55. Today’s doji (a candlestick with no body, basically showing that the opening and closing prices are almost the same)shows significant volatility and selling pressure at round number resistance. The 50-day EMA sits well above the 200-day EMA, maintaining a bullish longer-term structure, but the immediate price action below both the opening price and the psychological $960 level suggests near-term weakness.
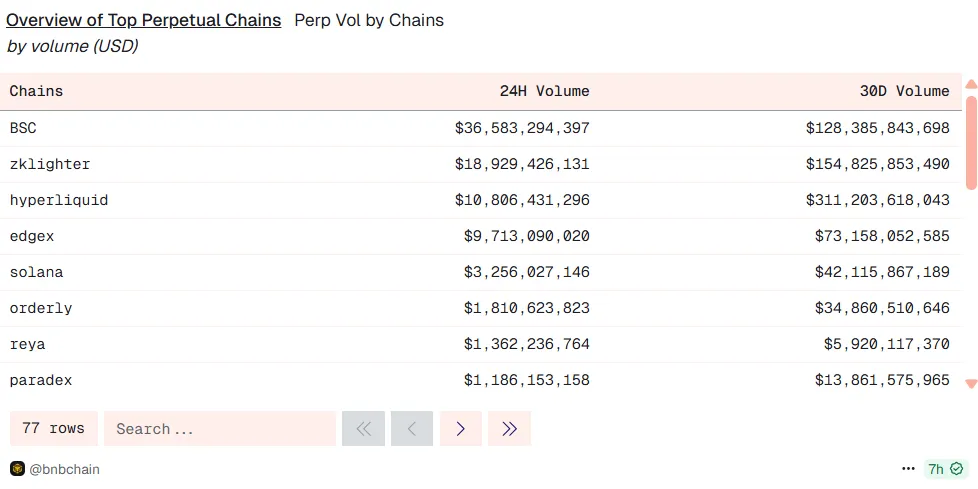
The catalyst for BNB's initial surge was clear: BNB Chain's 24-hour perpetual volume stands at $36 billion, overtaking Hyperliquid's $10.8 billion, driven primarily by the meteoric rise of Aster. However, today's correction suggests traders are taking profits on the Aster-driven rally.
Disclaimer
The views and opinions expressed by the author are for informational purposes only and do not constitute financial, investment, or other advice.
