Chainlink Primed for 26% Surge as Exchange Reserves Hit Rock Bottom - Elliott Wave Pattern Confirms Bullish Outlook

Chainlink's supply is vanishing from exchanges at an alarming rate—just as a classic Elliott Wave pattern signals explosive upside potential.
The Great Drain
Exchange reserves are plummeting, suggesting investors are moving LINK off platforms and into cold storage. That typically means one thing: reduced selling pressure and accumulation in strong hands.
Wave Theory in Motion
The Elliott Wave setup points toward a 26% surge from current levels. This isn't amateur chart reading—it's a technical pattern that has preceded major moves across crypto markets for years.
Smart money isn't waiting around for the breakout. They're pulling tokens from exchanges faster than traditional finance can print another 'inflation is transitory' headline.
When supply dries up and technicals align, you get a powder keg waiting for a spark. Chainlink's infrastructure role in DeFi and real-world asset tokenization makes it more than just a speculative play—it's becoming the plumbing for the next financial system.
Of course, in crypto, even the most beautiful chart can get wrecked by a single Elon tweet or regulatory tantrum. But for now, the stars are aligning—and Wall Street's still trying to figure out how to short the wrong asset.
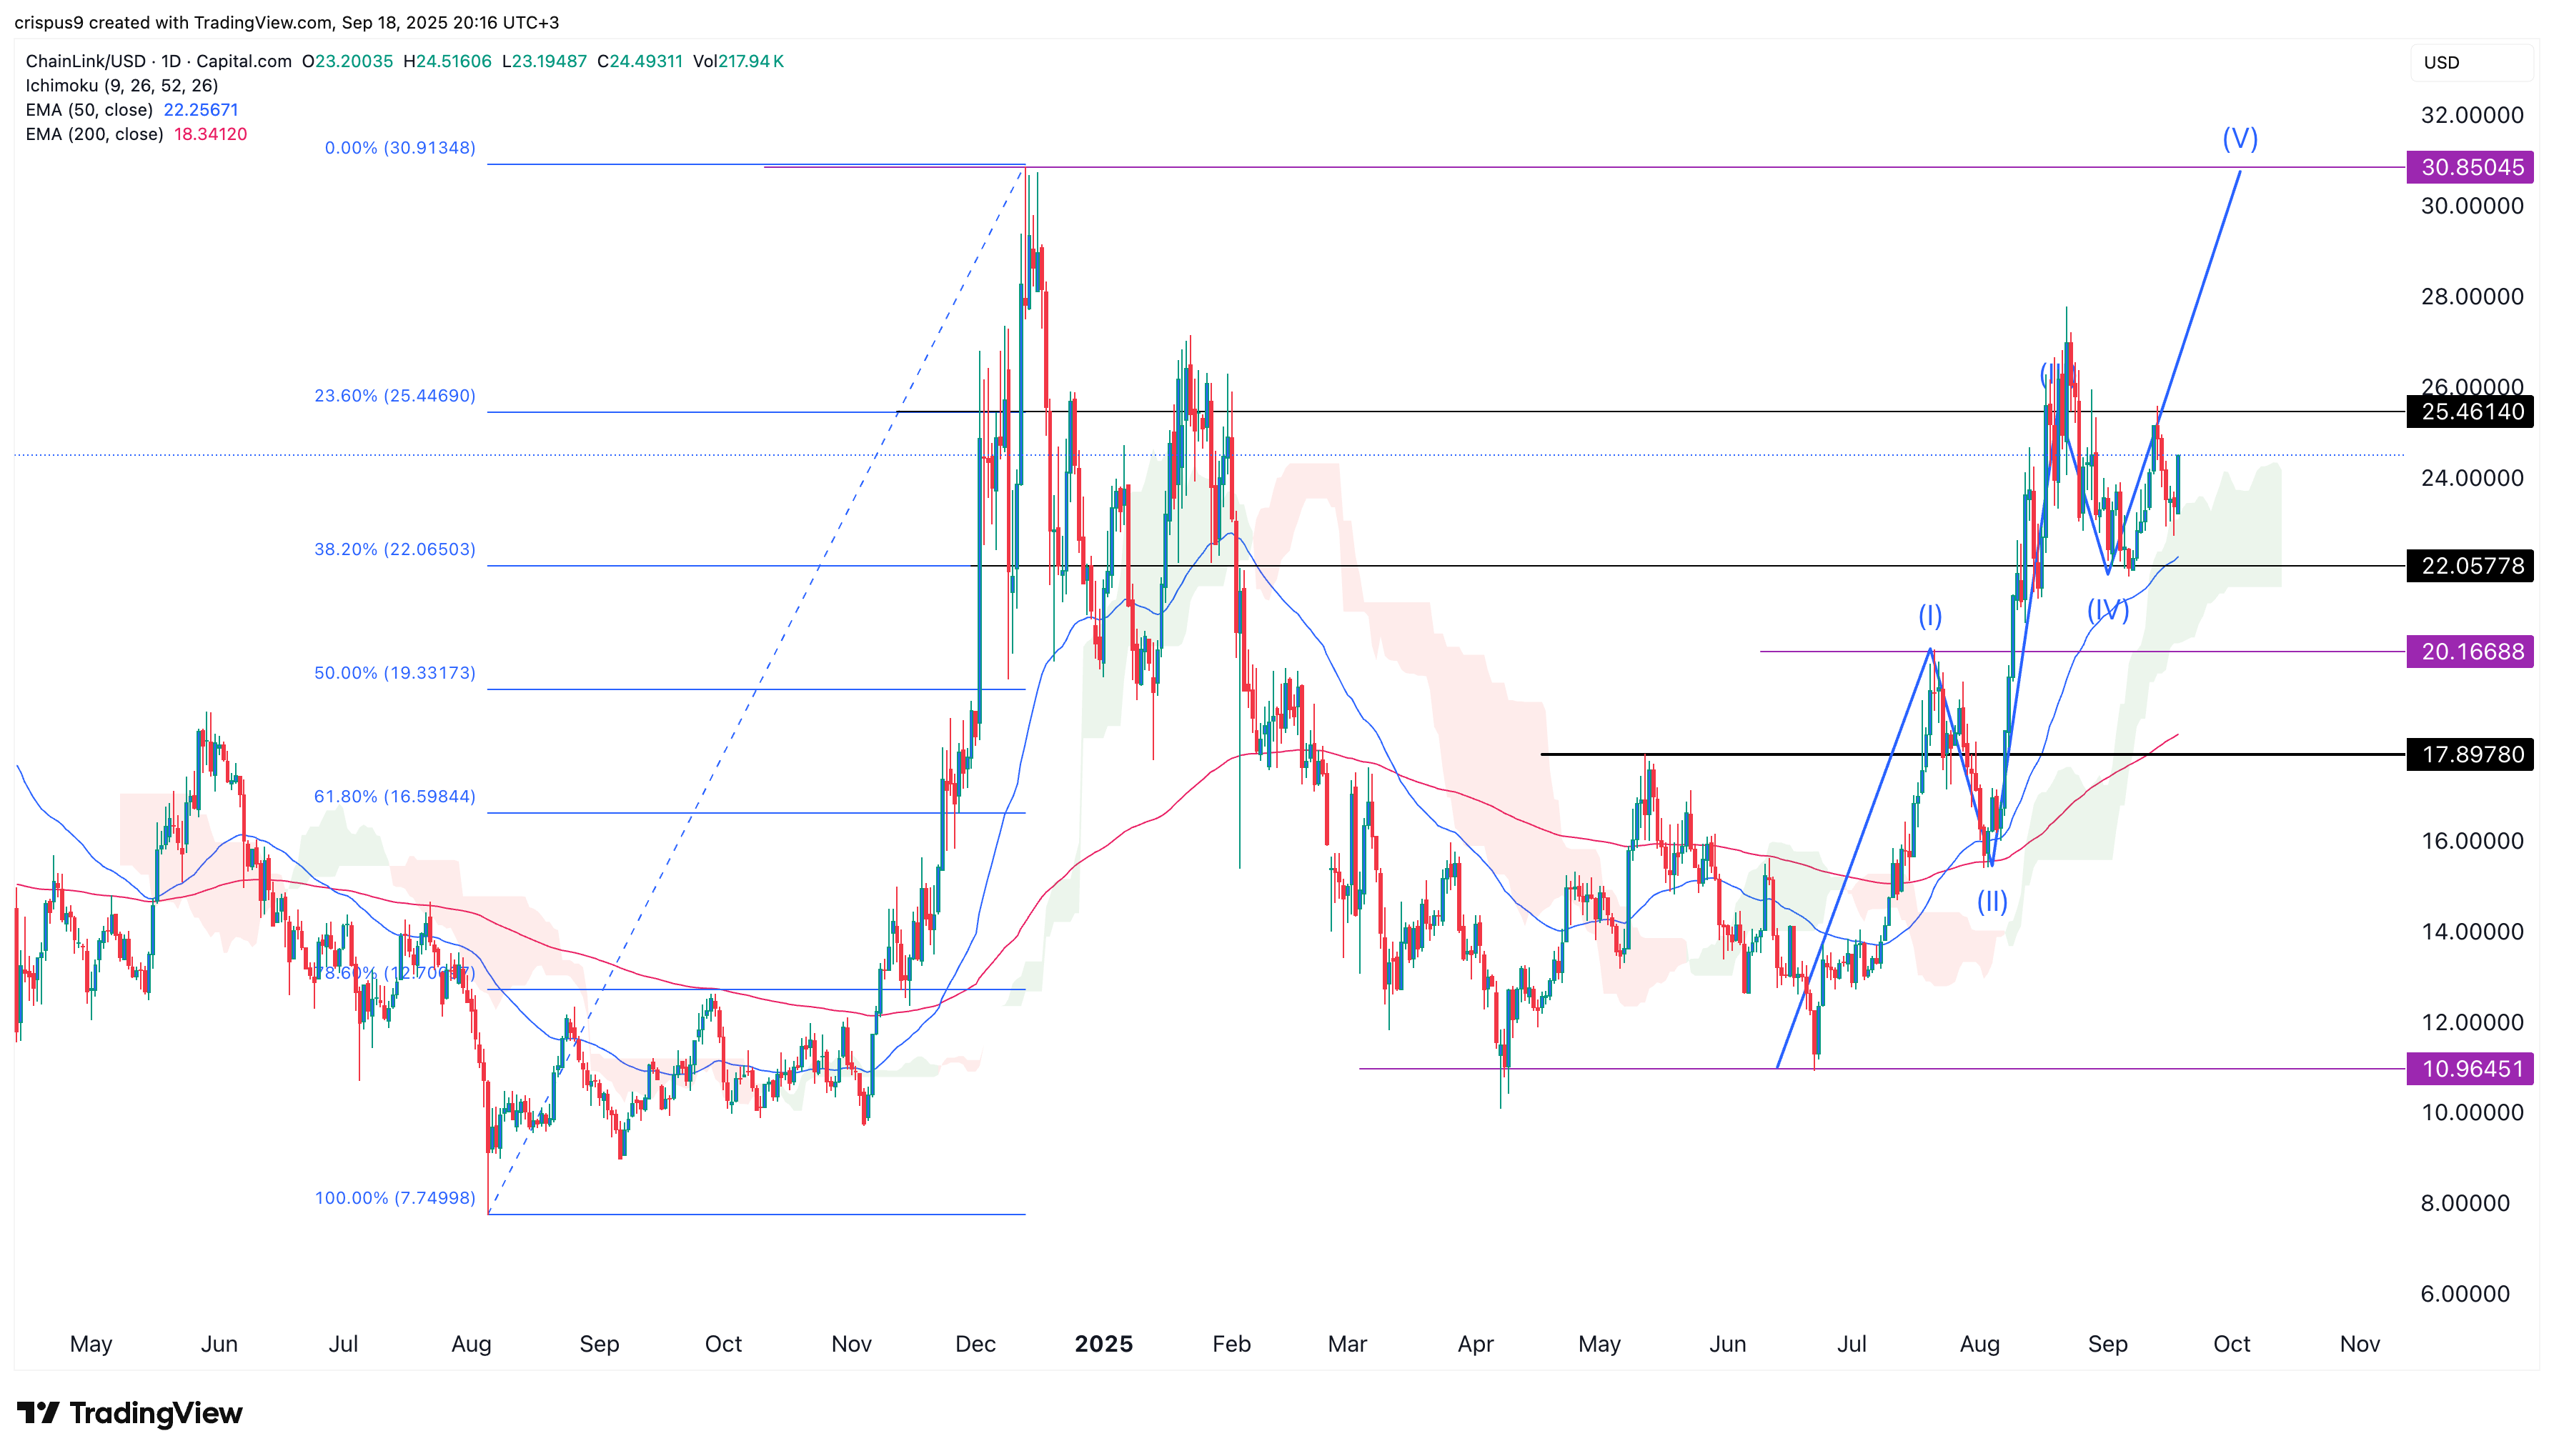
Chainlink price Elliot Wave analysis
The daily chart shows that the chainlink (LINK) price formed a double-bottom pattern at $10.96 and a neckline at $17. It moved above that level in August.
The coin then formed a golden cross pattern in July as the 50-day moving average moved above the 200-day moving average. It has remained above the two averages and the Ichimoku Cloud indicator since then.
Meanwhile, the coin has been in the impulse phase of the Elliott Wave analysis. It formed the first wave between July 1 and 23. It then formed the second bearish phase in the last week of July and the first week of August.
The coin then formed the third Elliott Wave and is now in the fourth one. It has now moved to the fifth phase, which will push it to last November’s high of $30, which is about 25% above the current level.
The bullish chainlink price forecast will become invalid if the price moves below the key support at $22. This price coincides with the lowest level this month and the 38.2% Fibonacci retracement level.
LINK supply in exchanges is crashing
A key catalyst for the Chainlink price is that the supply in exchanges has been in a strong downtrend in the past few months, a sign that investors are not selling their coins.
There are now 265.98 million LINK tokens in exchanges, down from 273 million on August 8. At the same time, the top 100 addresses hold over 648.85 million tokens, up from 635.9 million on August 19.
$LINK reserves are plunging fast.
SUPPLY SHOCK LOADING! pic.twitter.com/np4aIUmAkk
There are other bullish catalysts for the Chainlink price. For example, the weighted funding rate has remained above the green zone, a sign that investors anticipate the future price to be higher than the spot price.
Chainlink’s futures open interest has also been in an uptrend, moving from a low of $500 million in June to over $1.65 billion, a sign of its strong demand.
Chainlink is attracting demand from investors because of its role in the cryptocurrency industry. It is the biggest oracle provider with a total value secured of over $64 billion.
Chainlink has also become a major player in the real-world asset tokenization industry, providing solutions to companies such as JPMorgan, Swift, and UBS.
The coin will also benefit from the potential LINK ETF approval by the Securities and Exchange Commission, which will lead to more demand over time.
