Bitcoin Primed for $117K Surge as Selling Pressure Plummets to Historic Lows

Bitcoin's supply squeeze intensifies as exchange outflows accelerate—traders are hoarding, not selling.
Market Dynamics Shift Dramatically
With sell-side pressure evaporating faster than a meme coin's promises, BTC's path to $117K looks increasingly inevitable. Whales are accumulating, retail FOMO is building, and traditional finance skeptics are quietly rebalancing their portfolios (while still denying crypto's legitimacy, of course).
Technical Breakout Imminent
The charts don't lie—every resistance level crumbles under institutional buying pressure that would make a central banker blush. This isn't speculation anymore; it's simple supply-demand mathematics meeting digital scarcity.
While traditional markets play with fractional reserve tricks, Bitcoin's proving that real value doesn't need printing presses—just unstoppable code and collective belief. The $117K target isn't a prediction; it's an inevitability waiting for slow money to catch up.
Analysts flag easing Bitcoin sell pressure
On Sept. 16, crypto analyst Ali Martinez noted that Bitcoin’s Sell-Side Risk Ratio had dropped below 0.1%, a level often associated with local bottoms, reduced sell pressure, and accumulation phases. Additionally, he pointed out that $116,963 is a crucial supply wall where sellers might try to profit if Bitcoin keeps rising.
Bitcoin $BTC Sell-Side Risk Ratio just dropped below 0.1%. This level often signals local bottoms, accumulation phases, and low sell pressure. pic.twitter.com/lbP8JOe8Of
— Ali (@ali_charts) September 16, 2025Meanwhile, CryptoQuant contributor Arab Chain pointed to a sharp rise in the Bitcoin Scarcity Index on Binance, the first spike since June. When exchange supply thins out, either as a result of large investor withdrawals or a decline in sell orders, this index often rises. When this last happened, Bitcoin ROSE to $124,000.
However, Arab Chain cautioned that if the spike fades quickly, it could reflect speculative activity rather than sustained buying. A prolonged positive reading, by contrast, could confirm the beginning of a strong accumulation phase.
Bitcoin price technical analysis
On its daily chart, Bitcoin shows consolidation just below resistance at $117,525, and it is currently trading NEAR the upper Bollinger Band. While the relative strength index, which is at 58, indicates neutral momentum, the Momentum and MACD indicators flash buy signals, indicating a bullish short-term scenario.
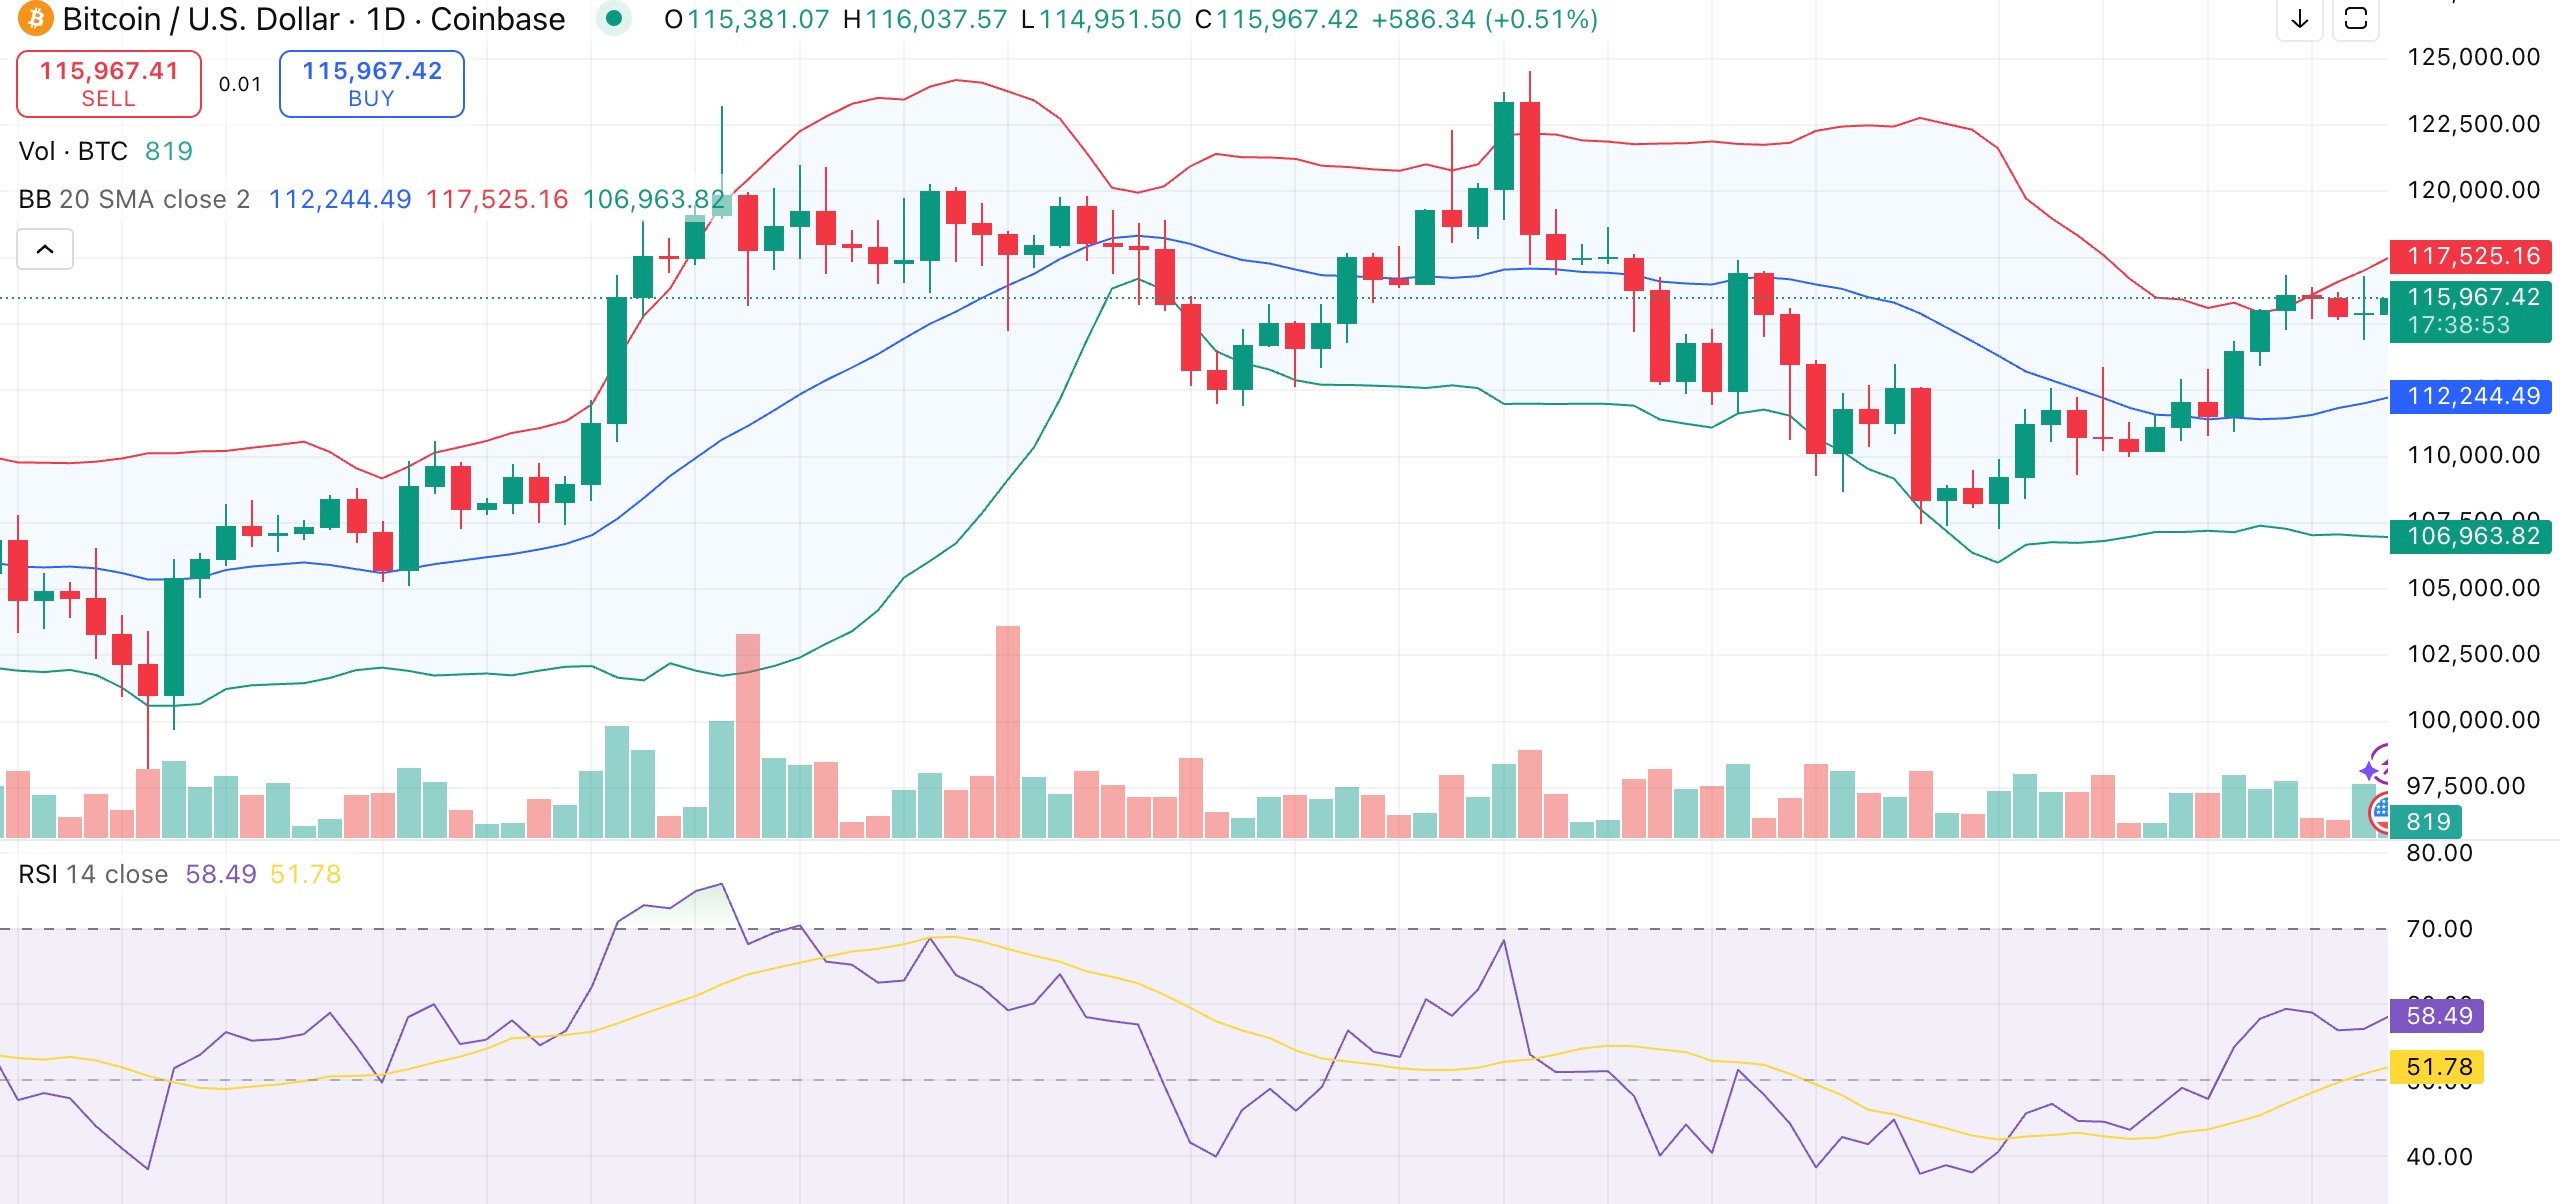
Moving averages continue to be very supportive as Bitcoin trades above its 50-, 100-, and 200-day levels, all of which flash “buy.” This alignment indicates underlying strength, even though the commodity channel index and stochastic RSI point to overbought conditions and the possibility of a brief decline.
If Bitcoin breaks above the resistance level between $116,963 and $1117,525, it might retest its all-time high of $124,128 from August. However, the price may return to support at $112,244 and perhaps $106,963 if this is not done.
