Pump.fun Drops $95M Bombshell with Massive Token Buyback Spree

Memecoin platform makes nine-figure power move to stabilize ecosystem
The Buyback Breakdown
Pump.fun just deployed nearly $95 million—yes, with an M—in a calculated token repurchase blitz. The platform isn't just throwing cash around; it's strategically pulling tokens off the market to reduce circulating supply and potentially boost valuations. Talk about putting your money where your memes are.
Market Mechanics at Play
This isn't charity—it's financial engineering. By soaking up liquidity, Pump.fun creates artificial scarcity while signaling confidence to holders. The move echoes traditional stock buybacks, just with more volatility and way funnier token names. Because nothing says 'sound investment' like a dog-themed coin with a 500% APR.
Because when your business model involves internet jokes becoming financial instruments, sometimes you need to spend $95 million just to keep the circus tent from collapsing.
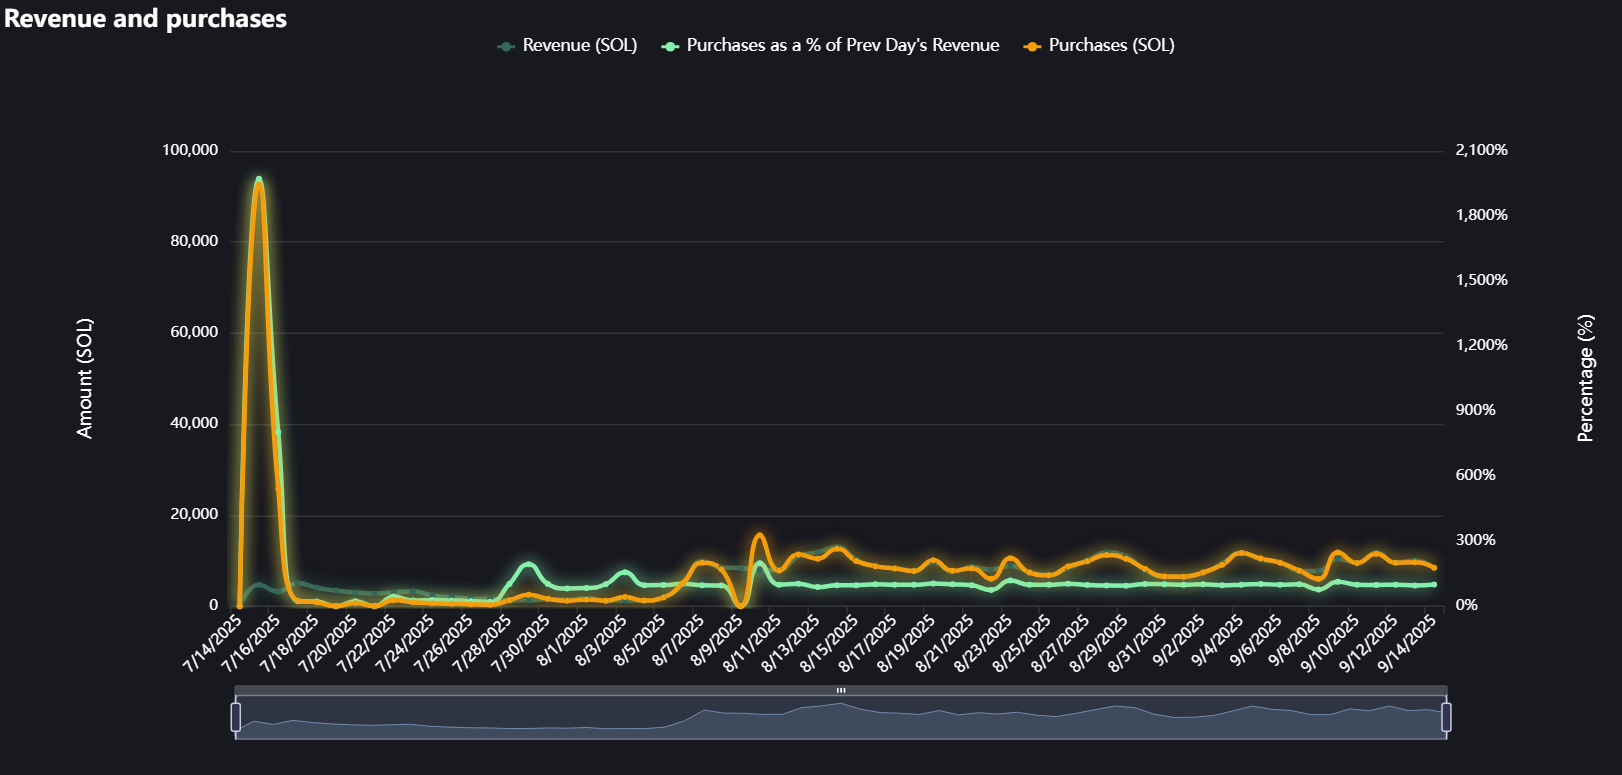 Chart showcasing Pump.fun’s token buyback strategy until Sept. 14, 2025 | Source: fees.pump.fun
The meme coin platform has managed to soak up over 6.58% from its total circulating supply, which currently stands at 1 trillion PUMP.
“Pump.fun currently expects to use substantially all net revenue for strategic investments. Pump.fun may modify or discontinue those plans at any time. The $PUMP token does not represent a right to revenues or any other distribution,” wrote the platform underneath a chart showcasing its revenue buybacks.
The project uses platform-generated revenue from its meme coin launchpad site to make daily token repurchases. So far, it has bought more than 23.1 billion tokens, as the platform looks to stabilize price action and reduce sell pressure.
Pump.fun price analysis
Pump.fun’s strategy seems to be working in its favor. On September 14, the token reached a new all-time high at $0.0088. Its current price stands only 10% below its recent high.
According to data from TradingView, the chart for PUMP/USDT shows a strong bullish rally that recently peaked after a sharp upward movement of more than 150%. This explosive surge was followed by a short-term pullback period, with prices consolidating around the 140% to 160% range.
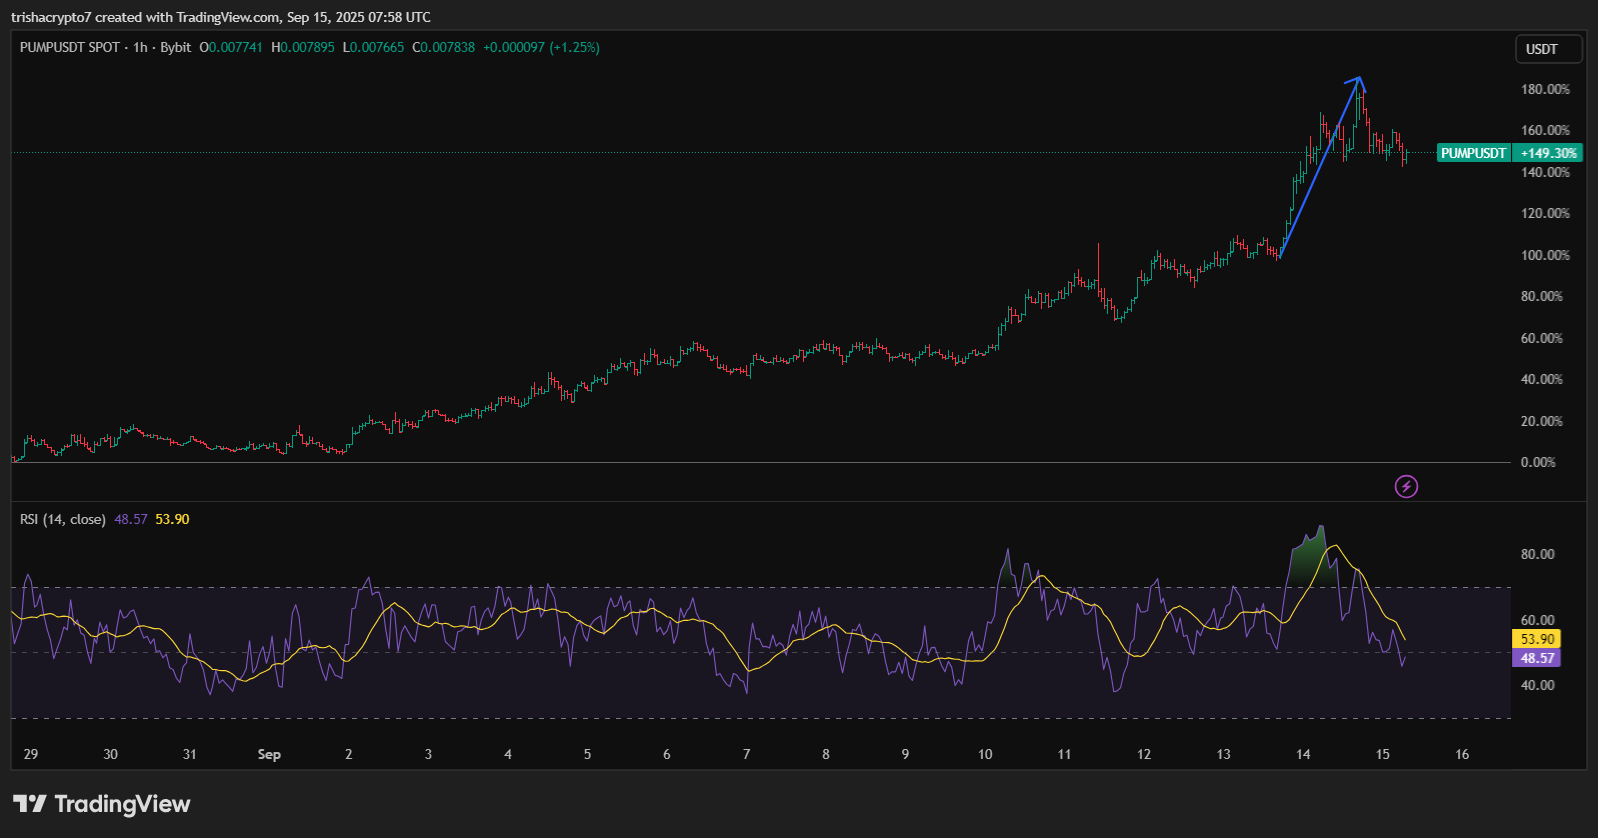
The steep climb indicates aggressive buying pressure, likely driven by speculative inflows or a breakout from accumulation.
Based on the Relative Strength Index indicator, momentum reached overbought conditions during the peak but has since cooled off. Currently, the RSI sits around the 48 to 53 range, showing a neutral stance with neither strong bullish nor bearish momentum being shown.
This decline from the overbought zone suggests that the sharp rally has lost steam in the short term, but the market has not yet gone completely on the bearish side.
