Mantle (MNT) Soars to Record $1.68 High - Is This Just the Beginning?

Mantle rockets past previous resistance levels, smashing through the $1.68 barrier to set a blistering new all-time high.
The Momentum Builds
Traders are scrambling as MNT's parabolic move defies broader market sluggishness—because nothing says 'healthy market' like one token mooning while everything else flatlines.
Technical indicators scream overbought, but since when did crypto care about traditional metrics? The rally either validates Layer 2 scaling solutions or proves once again that markets can stay irrational longer than you can stay solvent.
Watch those support levels. If $1.68 holds, we might be looking at the next governance token to make degens rich—until the next shiny object distracts them.
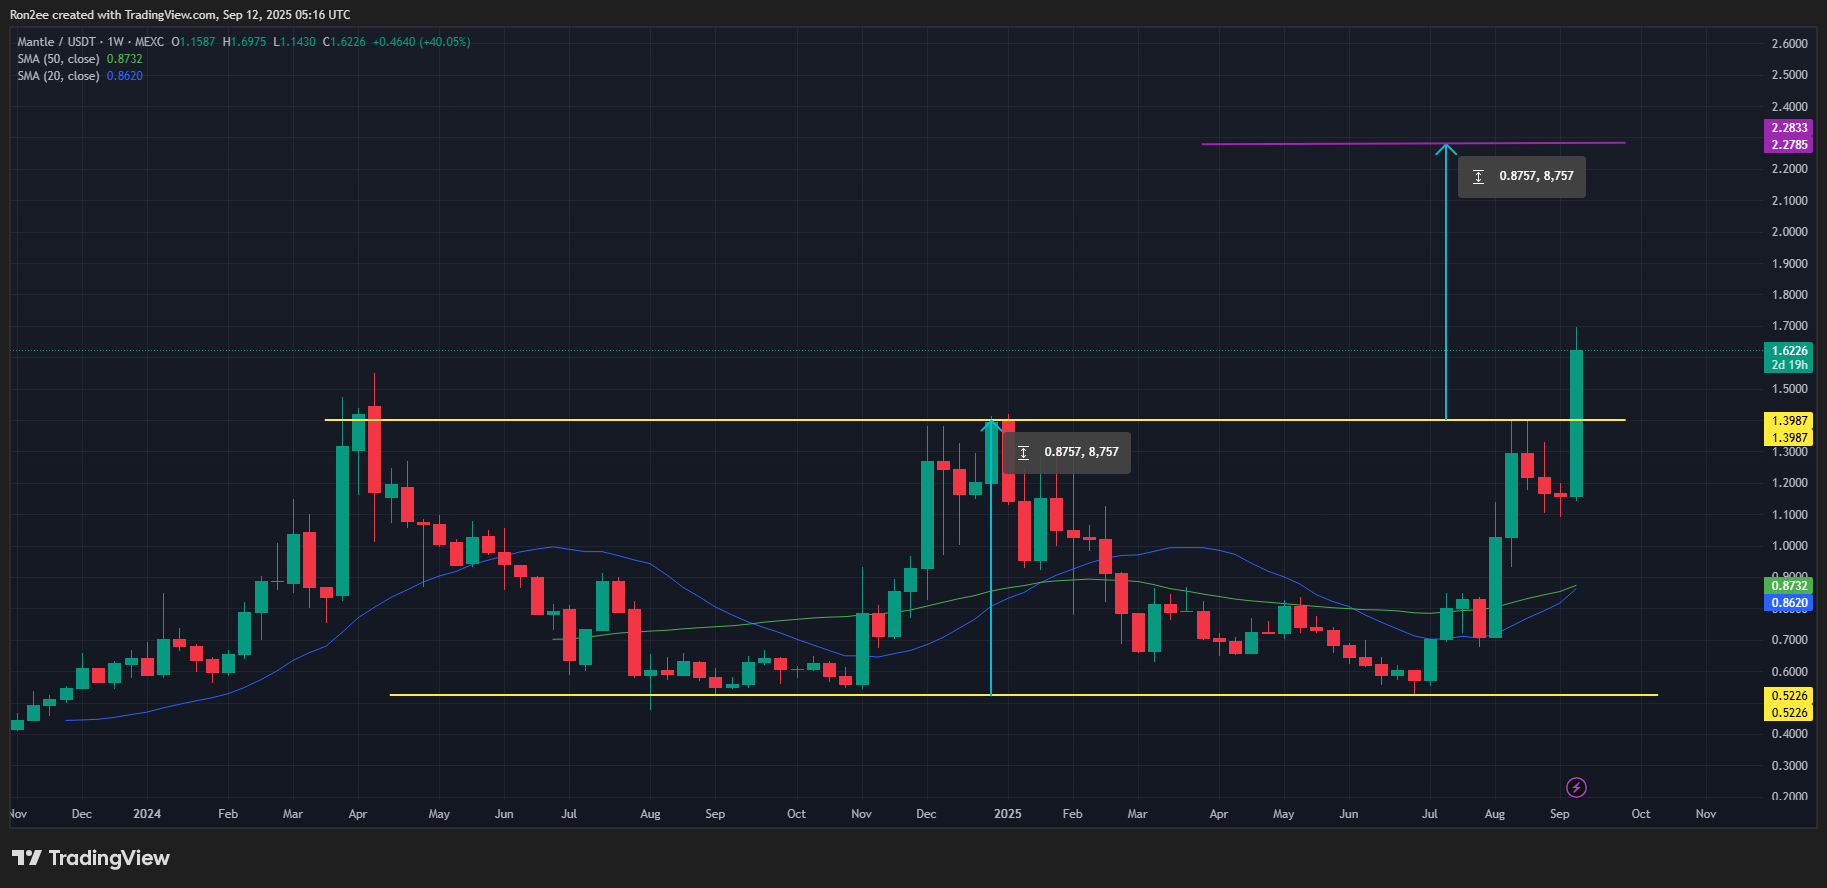 Mantle price forms a double bottom pattern on the weekly chart with a potential short-term golden cross also at play — Sep. 12 | Source: crypto.news
A double bottom is a bullish reversal pattern that forms when an asset tests a support level twice with a moderate high between the lows. For MNT, the two bottoms lie NEAR $0.52, while the neckline is positioned at $1.39.
MNT has already broken out above the neckline, and a successful retest of the $1.39 level as support WOULD confirm the breakout and validate the pattern.
Another potential bull sign was that the 20-day simple moving average is poised to cross above the 50-day moving average. If confirmed, this would FORM a golden cross, a bullish signal that is often followed by multi-week rallies.
A look at the MACD indicator also shows the MACD lines have been trending upwards, accompanied by growing green histograms, which is another confirmation that bulls are the dominant force at the moment.
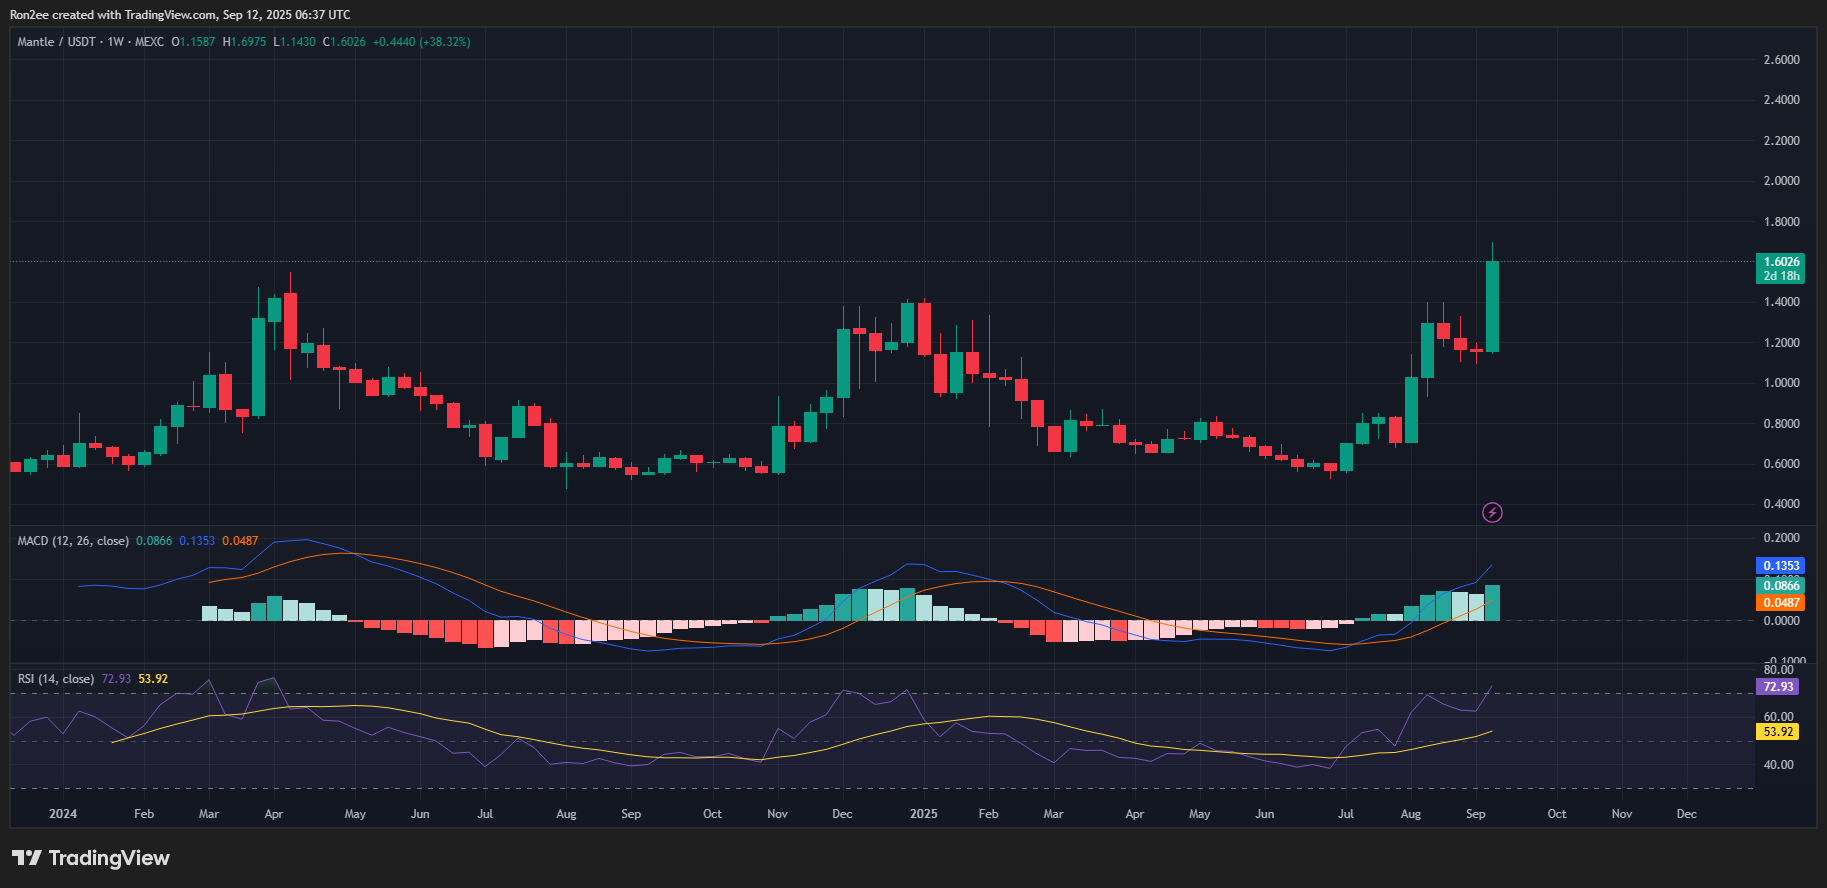
However, MNT’s Relative Strength Index has crossed into overbought territory. While this is a telltale sign that the rally could face short-term selling pressure, it does not necessarily indicate a trend reversal.
In many cases, RSI remains in the overbought area for an extended period, especially during times of strong momentum when buyers continue to dominate and push prices higher despite overheated technical readings.
Given this confluence of bullish technical signals, the next likely target for MNT lies at $2.28, 40% above the current price level. This is calculated by measuring the depth of the double bottom formation and adding it to the breakout point at $1.39.
However, a drop below the $1.39 neckline would invalidate the setup and could open the door for a reversal if sellers begin to regain control.
Disclosure: This article does not represent investment advice. The content and materials featured on this page are for educational purposes only.
