Mantle Shatters Records: Bybit Partnership Fuels Historic Rally to New All-Time High

Mantle just rocketed past its previous peak—the Bybit alliance sending traders into a frenzy as institutional money floods the Layer-2 space.
Why This Partnership Changes Everything
Bybit's deep liquidity pools meet Mantle's scaling solutions—creating a powerhouse combo that's sucking volume away from slower chains. No more gas wars, no more settlement delays—just pure trading velocity.
The Institutional Stamp of Approval
When major exchanges back a token, whales notice. This isn't retail FOMO—it's calculated capital deployment into infrastructure that actually works while legacy finance still debates ETF custody rules.
Where Does Mantle Go From Here?
New ATHs break psychological barriers—but they also attract profit-taking. Watch for consolidation above previous resistance—because in crypto, all-time highs are just invitations for the next squeeze. Remember: partnerships move markets, but fundamentals determine who's still standing when the leverage flushes out.
Bybit listings and rewards fuel Mantle price rally
The rally followed Mantle’s expanded partnership with Bybit, announced on Sept. 10. The initiative, referred to as “MNT x Bybit 2.0,” introduced new trading pairs, yield programs, and institutional features. Over three days, Bybit added several MNT spot pairs against assets such as SOL, ETH, ADA, and SUI.
The exchange also launched a “HODL & Earn” event, allowing users to share a 60,000 XUSD prize pool by holding MNT and XUSD until Sept. 16. Trading activity responded sharply. Mantle’s 24-hour spot volume reached $655 million, a 41% increase from the previous day. Derivatives activity also increased, according to Coinglass data.
Open interest rose 31% to $203 million, while the daily futures volume increased 117% to $268 million. Higher volume and rising open interest indicate that more traders are opening Leveraged positions, which can amplify price fluctuations in either direction.
Mantle price technical analysis
Following its breakout from consolidation, MNT is now trading above $1.60 on the chart. Support is provided by short- and medium-term moving averages which are trending upward, such as the 10-day EMA ($1.32) and the 20-day SMA ($1.22). Momentum indicators are positive, with MACD and Momentum signaling further strength.
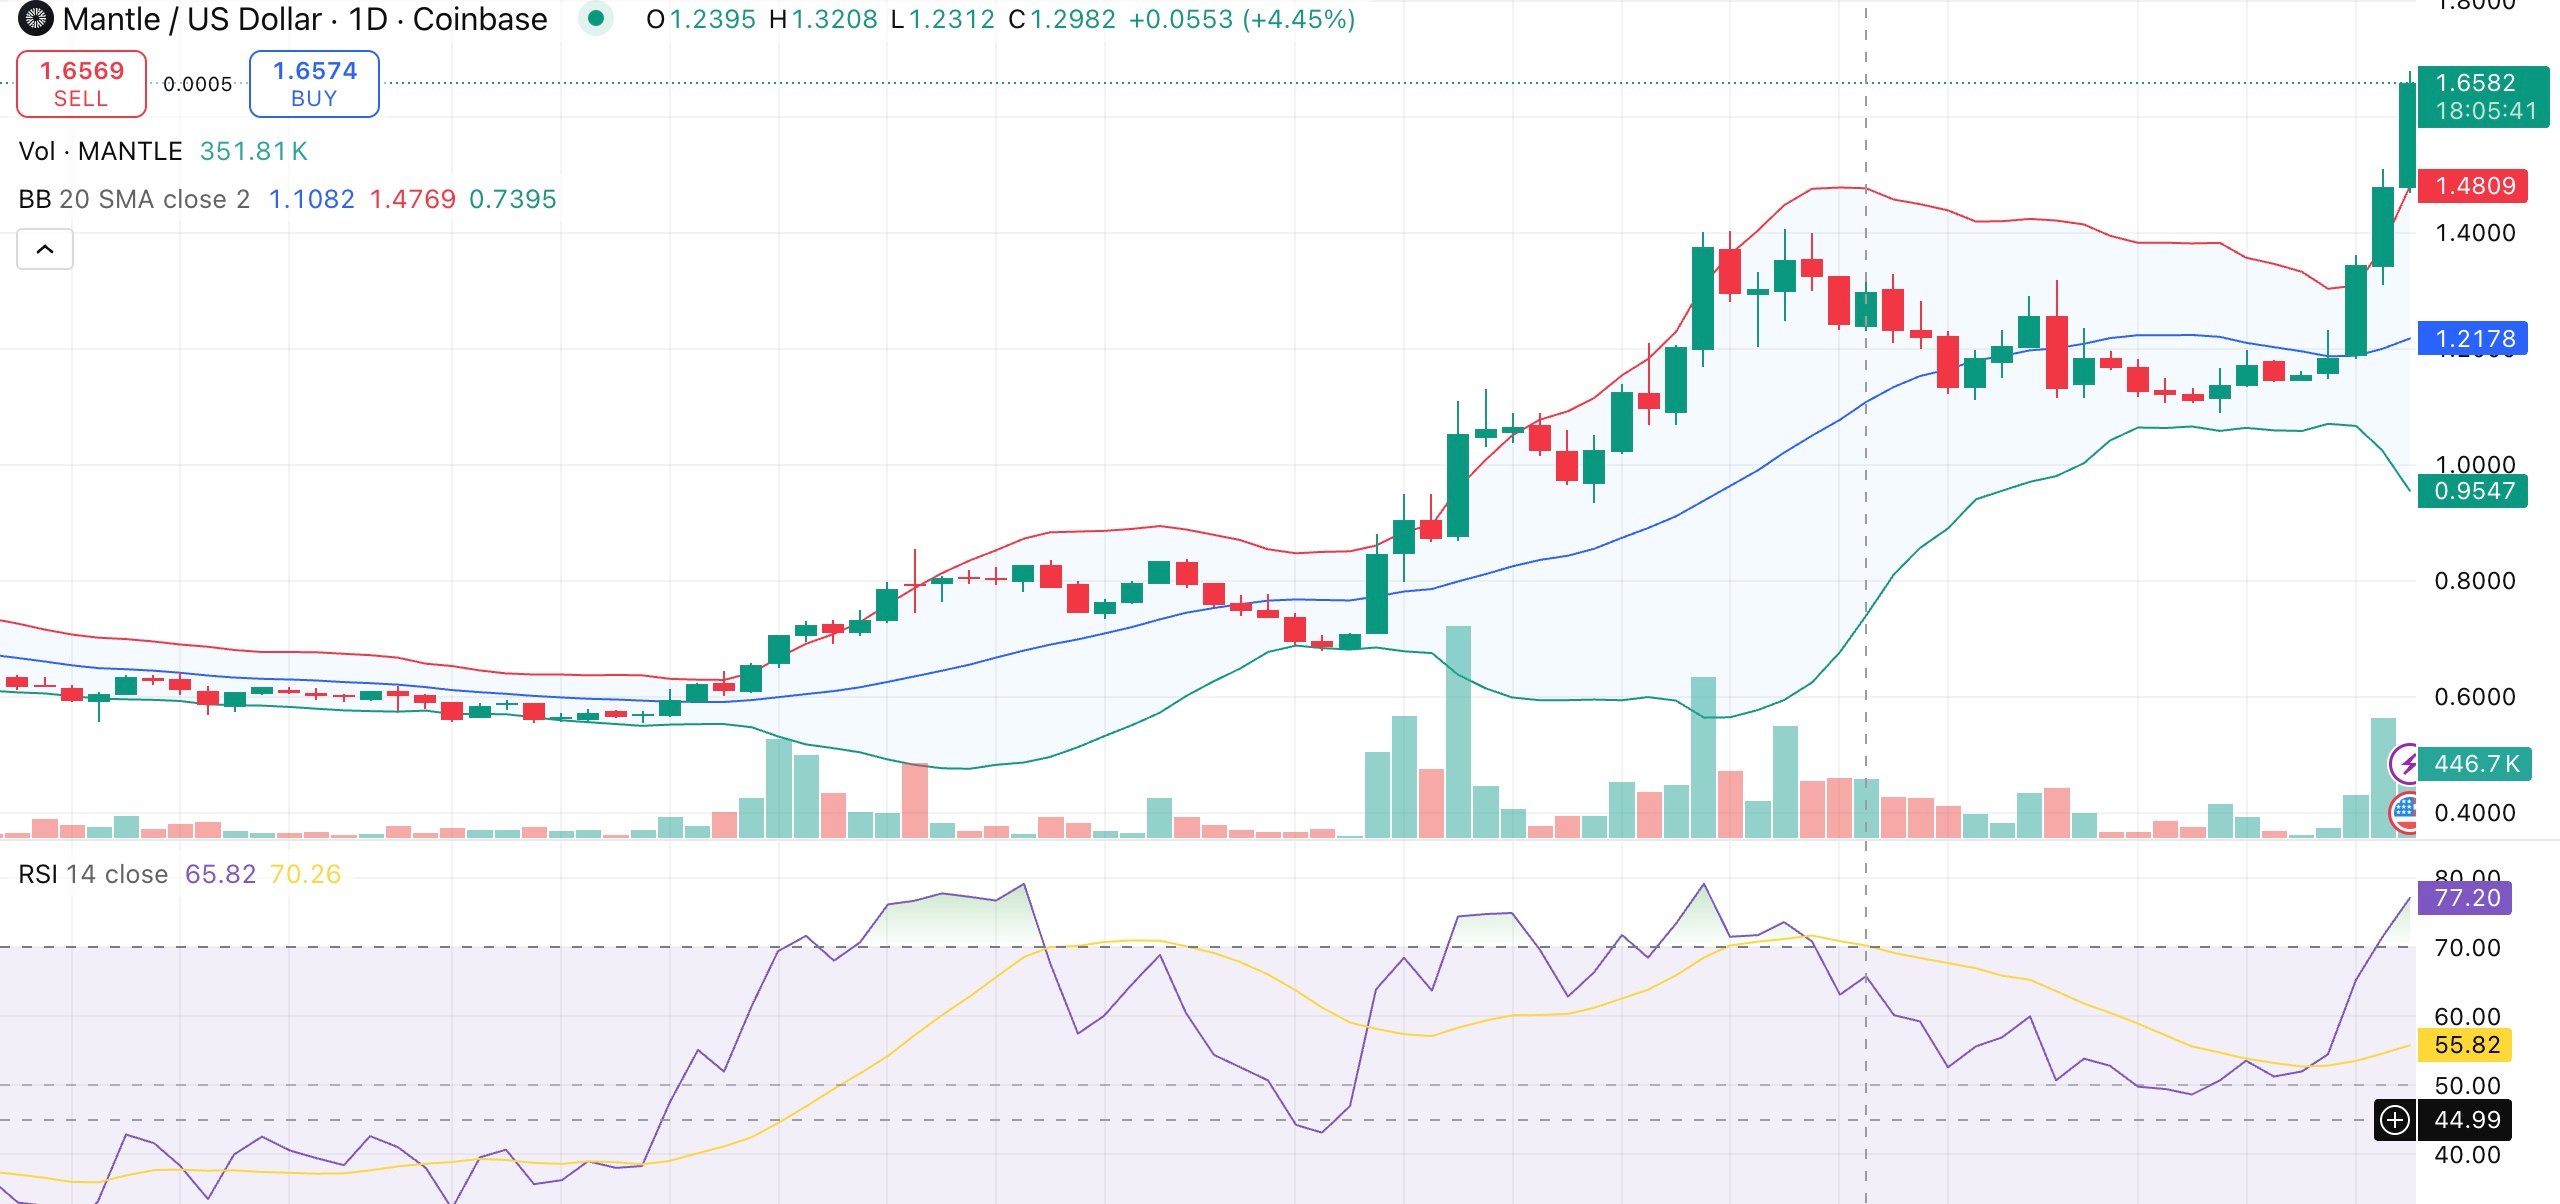
But overbought conditions are starting to appear. The relative strength index has risen above 70 and the commodity channel index is above 300, both of which are levels that often precede short declines. Bollinger Bands show price hugging the upper band, which reflects strong buying pressure but also increased risk of volatility.
Deeper support is located around $1.22, with key support close to $1.48. Resistance may be tested between $1.80 and $2.00 if the bullish momentum persists. A failure to hold support levels may trigger a correction toward $1.00.
