ONDO explose son fanion haussier : la crypto peut-elle effacer toutes les pertes d’août ?

ONDO vient de briser sa configuration technique haussière en forme de fanion — un signal technique puissant qui pourrait annoncer la fin de la correction d'août.
Momentum technique
Les traders repèrent maintenant un objectif technique situé bien au-dessus des plus hauts récents. La rupture du fanion suggère une reprise de la tendance haussière principale, avec des volumes qui commencent à affluer sur les plateformes d'échange.
Contexte macro
Alors que les actifs traditionnels stagnent dans l'incertitude monétaire, les cryptos comme ONDO surfent sur une dynamique technique propre — preuve que certains investisseurs préfèrent encore les graphiques aux fondamentaux, pour le meilleur ou pour le pire.
Risques et opportunités
Attention : une rupture de fanion n'offre aucune garantie. Les traders aguerris savent que les figures techniques fonctionnent... jusqu'à ce qu'elles ne fonctionnent plus. Mais pour l'instant, les acheteurs semblent reprendre le contrôle.
Rien ne garantit qu'ONDO effacera intégralement les pertes du mois dernier, mais la configuration actuelle offre en tout cas un bien meilleur contexte que les semaines précédentes. Les banques centrales peuvent bien tergiverser sur leurs taux directeurs, les cryptos, elles, n'attendent personne.
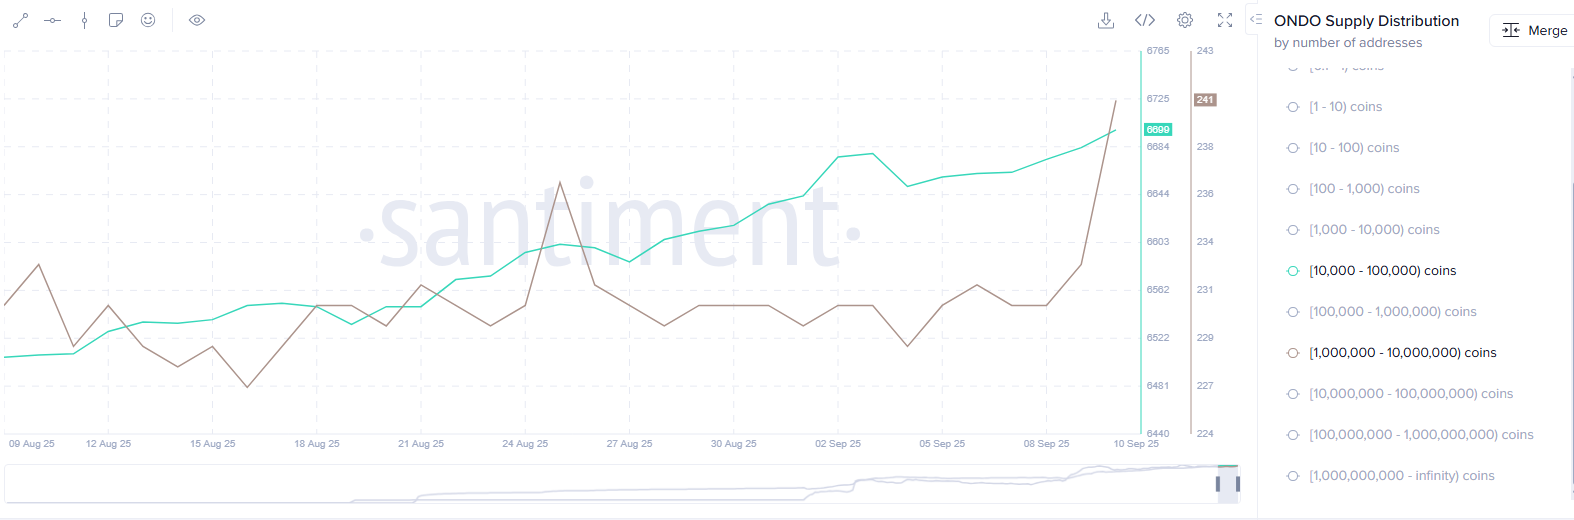 Source: Santiment
ONDO price has broken out of a bullish pennant
Source: Santiment
ONDO price has broken out of a bullish pennant
A look at the daily chart reveals that ONDO has been forming a bullish pennant pattern since July.
It is a short-term continuation pattern that is formed when an asset’s price prints back-to-back green candles as its price moves higher, thereby creating what is called a flagpole, which is then followed by a brief consolidation period, during which the price moves within converging trendlines, forming a small symmetrical triangle or pennant shape.
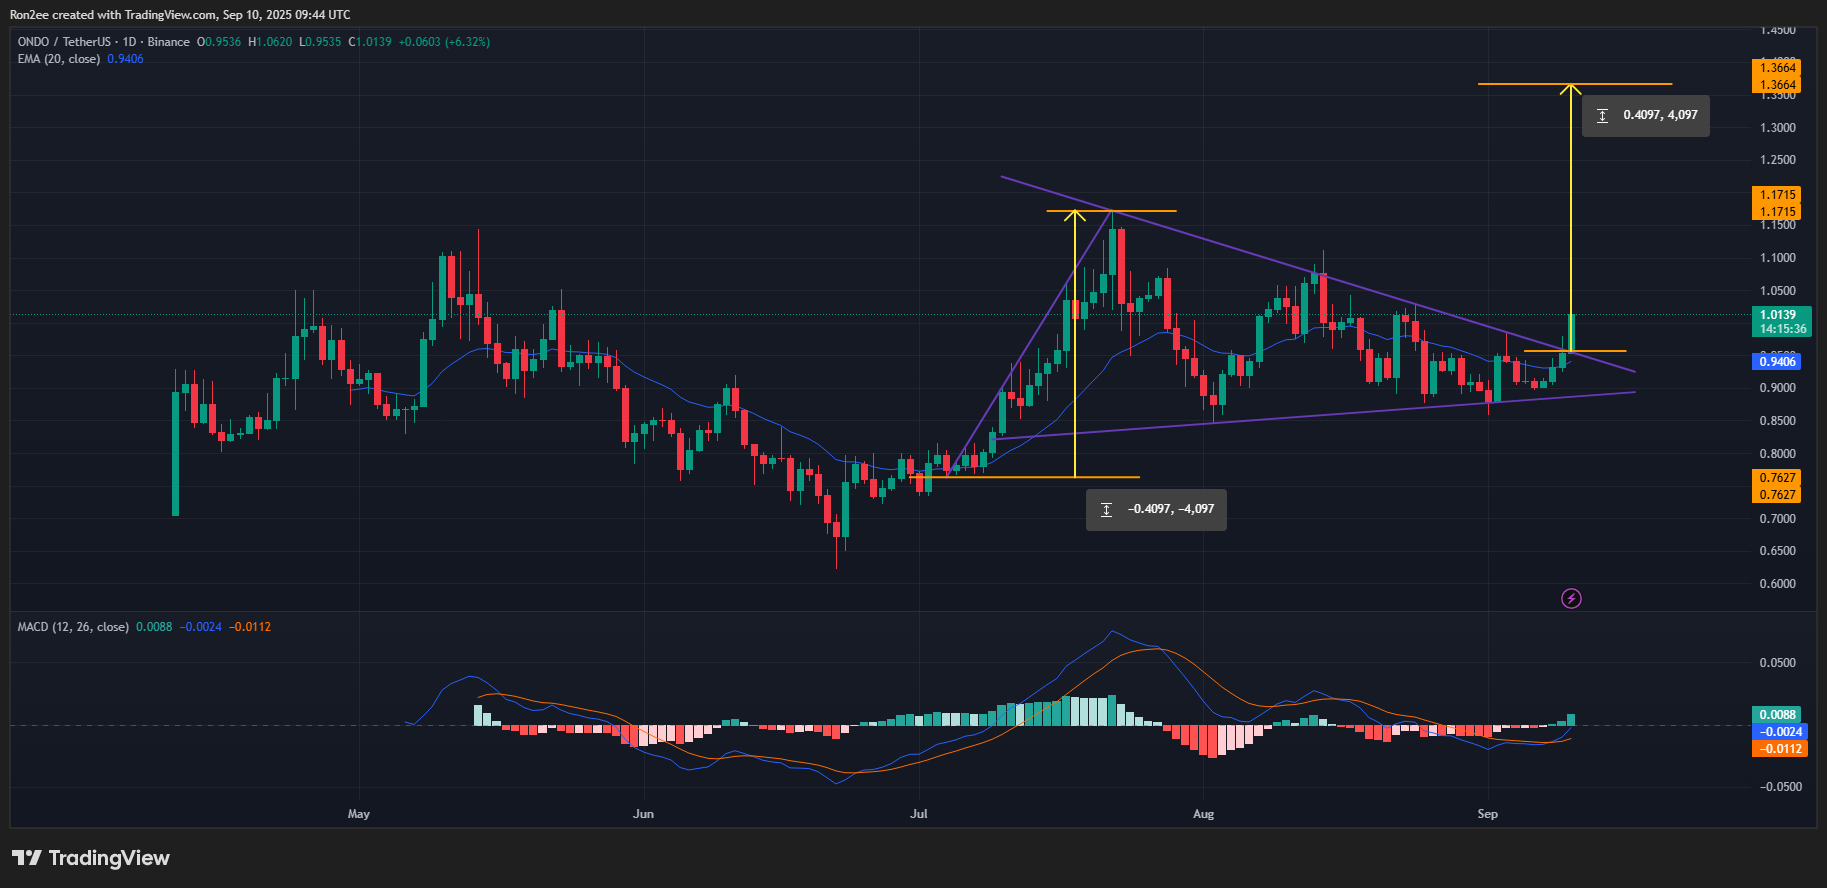
ONDO price has already broken upwards from the structure, confirming that buyers have regained control after the consolidation phase.
ONDO is also trading above the 20-day exponential moving average at press time, which further validates the current breakout.
Among other bullish technicals was the Moving Average Convergence Divergence indicator, which showed a positive crossover. When considering the current setup, this means market sentiment is tilting in favor of buyers, which supports the case for further upside in upcoming sessions.
Based on this, ONDO bulls WOULD most likely attempt to break through $1.17, which has acted as resistance during its run in July and is also the highest point of the upper trendline of the pennant pattern.
If successful, ONDO could be set for a run up to $1.36, the full projected MOVE based on the bullish pennant breakout. At press time, the target lies about 35% above its current price level of $1.01.
A drop below the 20-day EMA at $0.94, which traders often view as short-term support levels, would invalidate the setup.
Disclosure: This article does not represent investment advice. The content and materials featured on this page are for educational purposes only.
