Ethereum Defies Gravity: Binance Supply Plunge Ignites Bull Run Speculation

Ethereum's holding pattern just turned interesting—real interesting. As exchange reserves dwindle, smart money's betting on a supply squeeze that could send prices soaring.
The Binance Exodus
Binance's ETH vaults are bleeding dry. Whales are pulling coins off exchanges faster than you can say 'gas fee,' signaling a potential supply crunch. When coins leave exchanges, they're not coming back for quick trades—they're going into cold storage for the long haul.
Technical Breakout Imminent?
Traders are watching key resistance levels like hawks. The last time supply dried up this fast, ETH ripped 40% in three weeks. History doesn't repeat, but it sure rhymes—especially when network activity spikes and institutional wallets keep accumulating.
Market Psychology Shift
Fear's flipping to greed as derivatives data shows shorts getting squeezed. Funding rates turned positive while open interest screams 'breakout.' Even the crypto bros who usually YOLO into memecoins are quietly stacking ETH instead.
Regulatory Wildcard
Never count out the SEC to ruin a perfectly good rally—because nothing says 'healthy market' like bureaucrats deciding what constitutes a security five years after the fact.
Exchange balances show decline
According to a Sept. 4 analysis by CryptoQuant contributor Arab Chain, Ethereum’s Exchange Supply Ratio on Binance, the largest holder of ETH among exchanges, dropped sharply between mid-August and early September. The ratio slid from 0.041 to below 0.037 in just two weeks, marking the steepest decline in the observed period.
What sets the decline apart is the absence of a significant price correction. Ethereum stayed steady at $4,400 even as coins left Binance wallets, suggesting that investors are increasingly moving their assets into self-custody rather than keeping them available for trading.
Such actions have historically been a sign of market confidence. Because there is less ETH available for immediate sale, lower exchange balances reduce potential sell pressure. Combined with stable prices, this pattern often occurs before a shift into a new bullish phase.
Ethereum price technical analysis
Ethereum’s daily chart shows the price consolidating following its August peak. The narrowing Bollinger Bands indicate low volatility and a possible breakout.
Momentum readings are balanced. The relative strength index, at 51, is neutral while the MACD is slightly bearish. The larger uptrend is maintained by the strong support at $4,240.
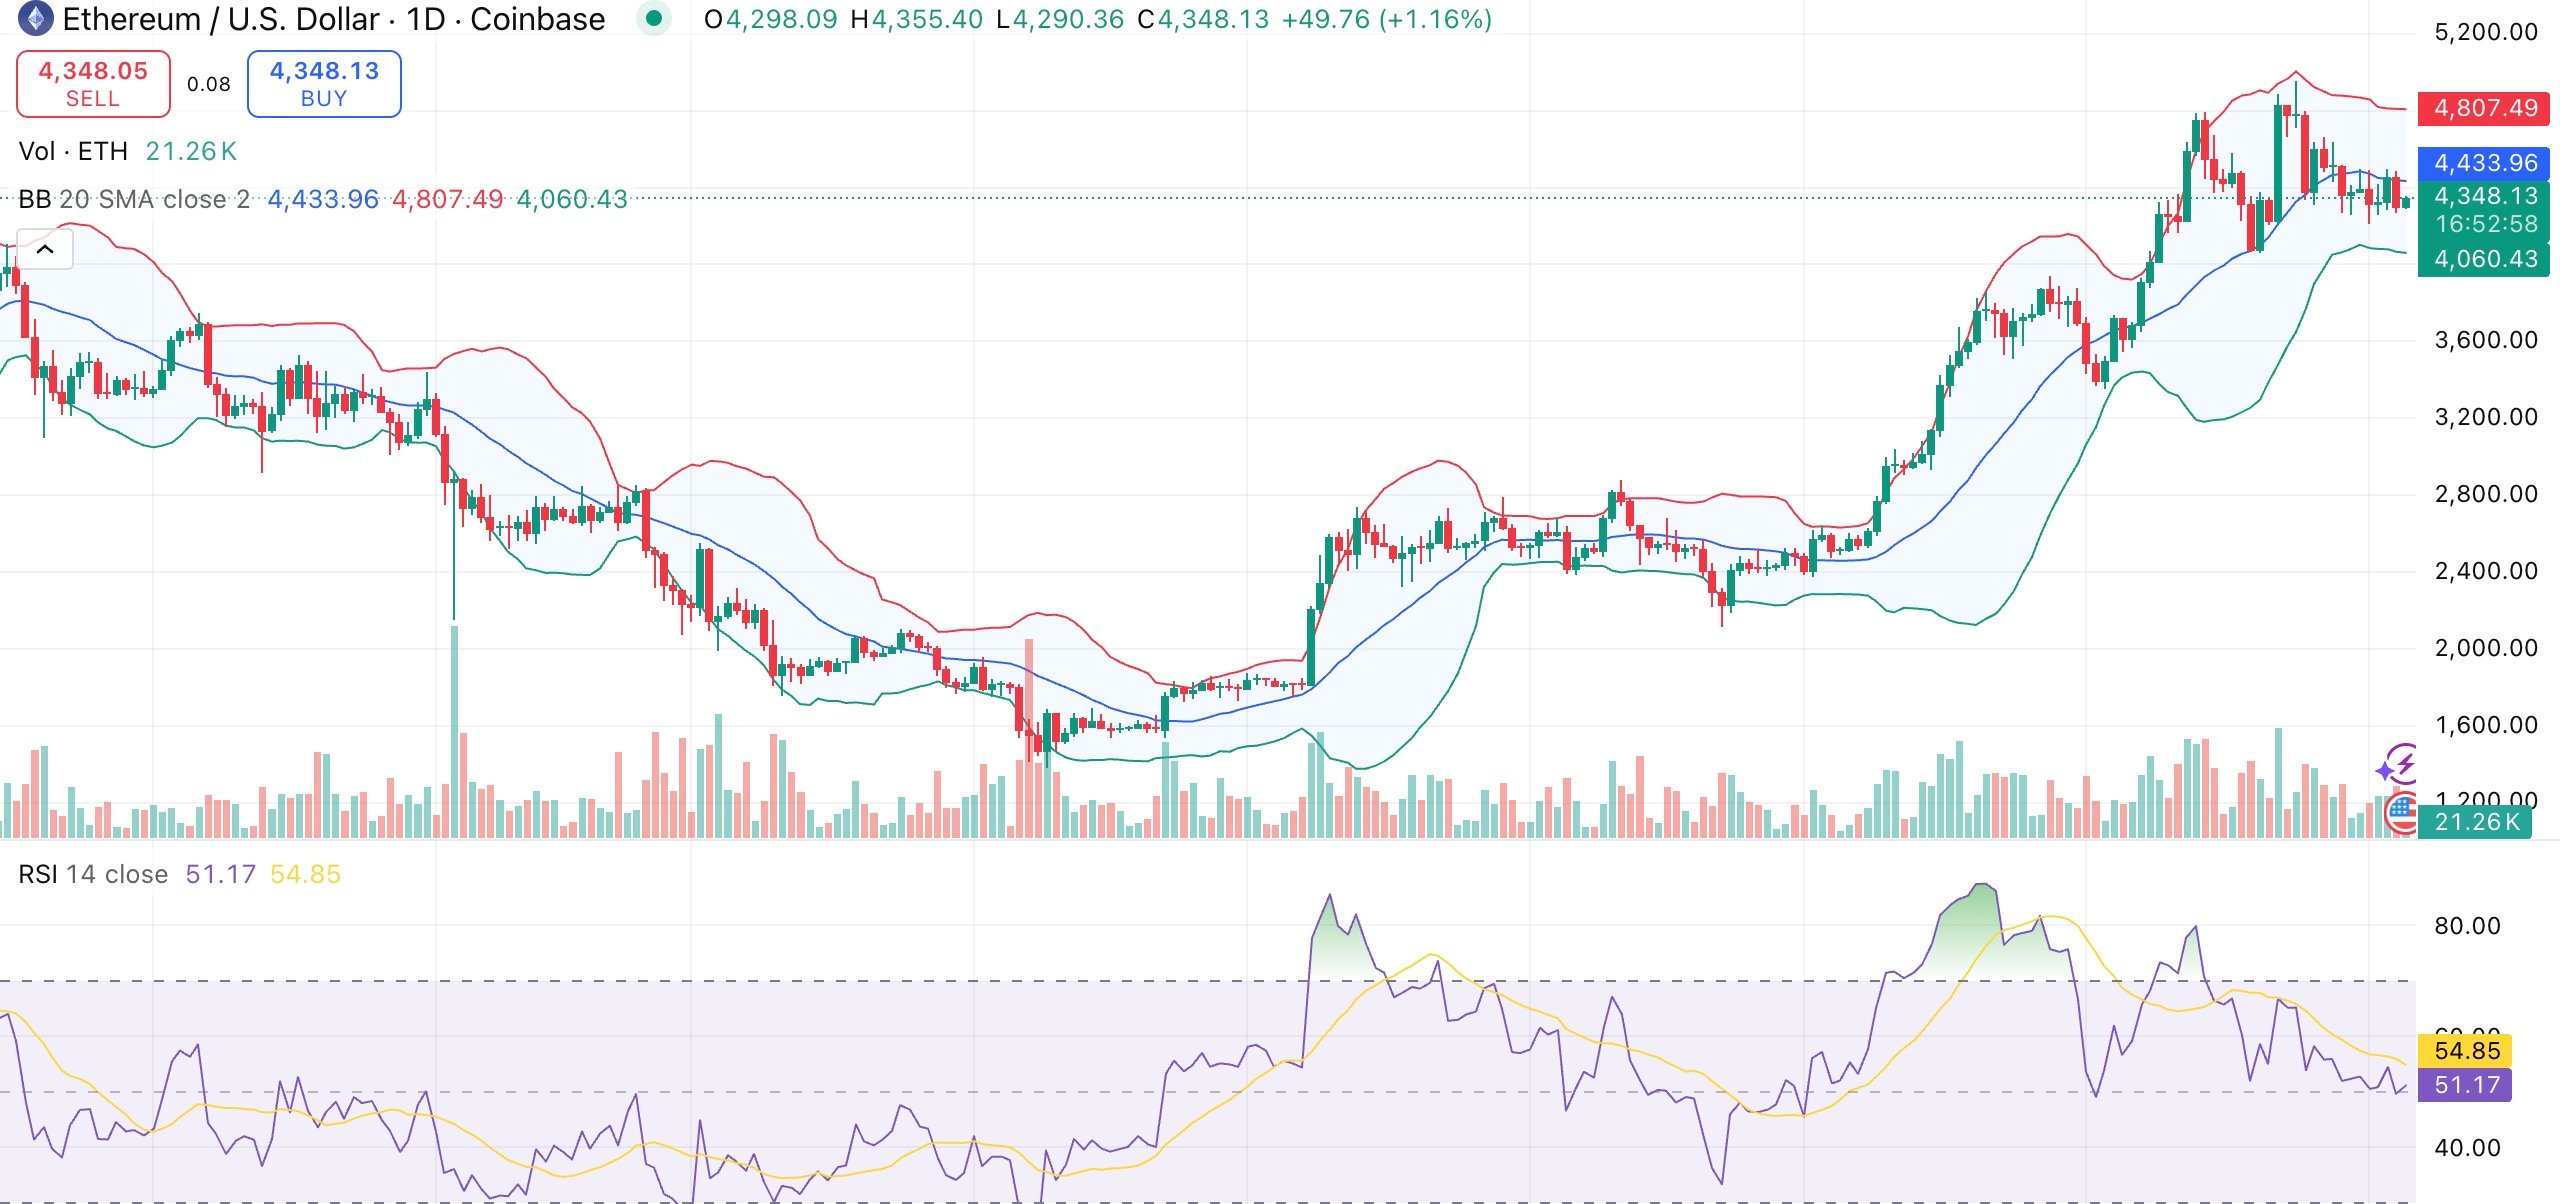
While the short-term signals of the 10- and 20-day moving averages point to weakness, the 30-, 50-, 100-, and 200-day moving averages all lean bullish, reflecting consistent long-term strength.
Ethereum may target $4,600 if it can overcome resistance at $4,480. If selling pressure increases, a deeper correction is likely. Failure to hold above $4,240 could open a MOVE toward $4,050.
