XRP Price Prediction: This Chart Pattern Signals a MAJOR Breakout Ahead

XRP just flashed its most bullish technical signal in months—and traders are positioning for explosive moves.
The Setup: Decoding the Pattern
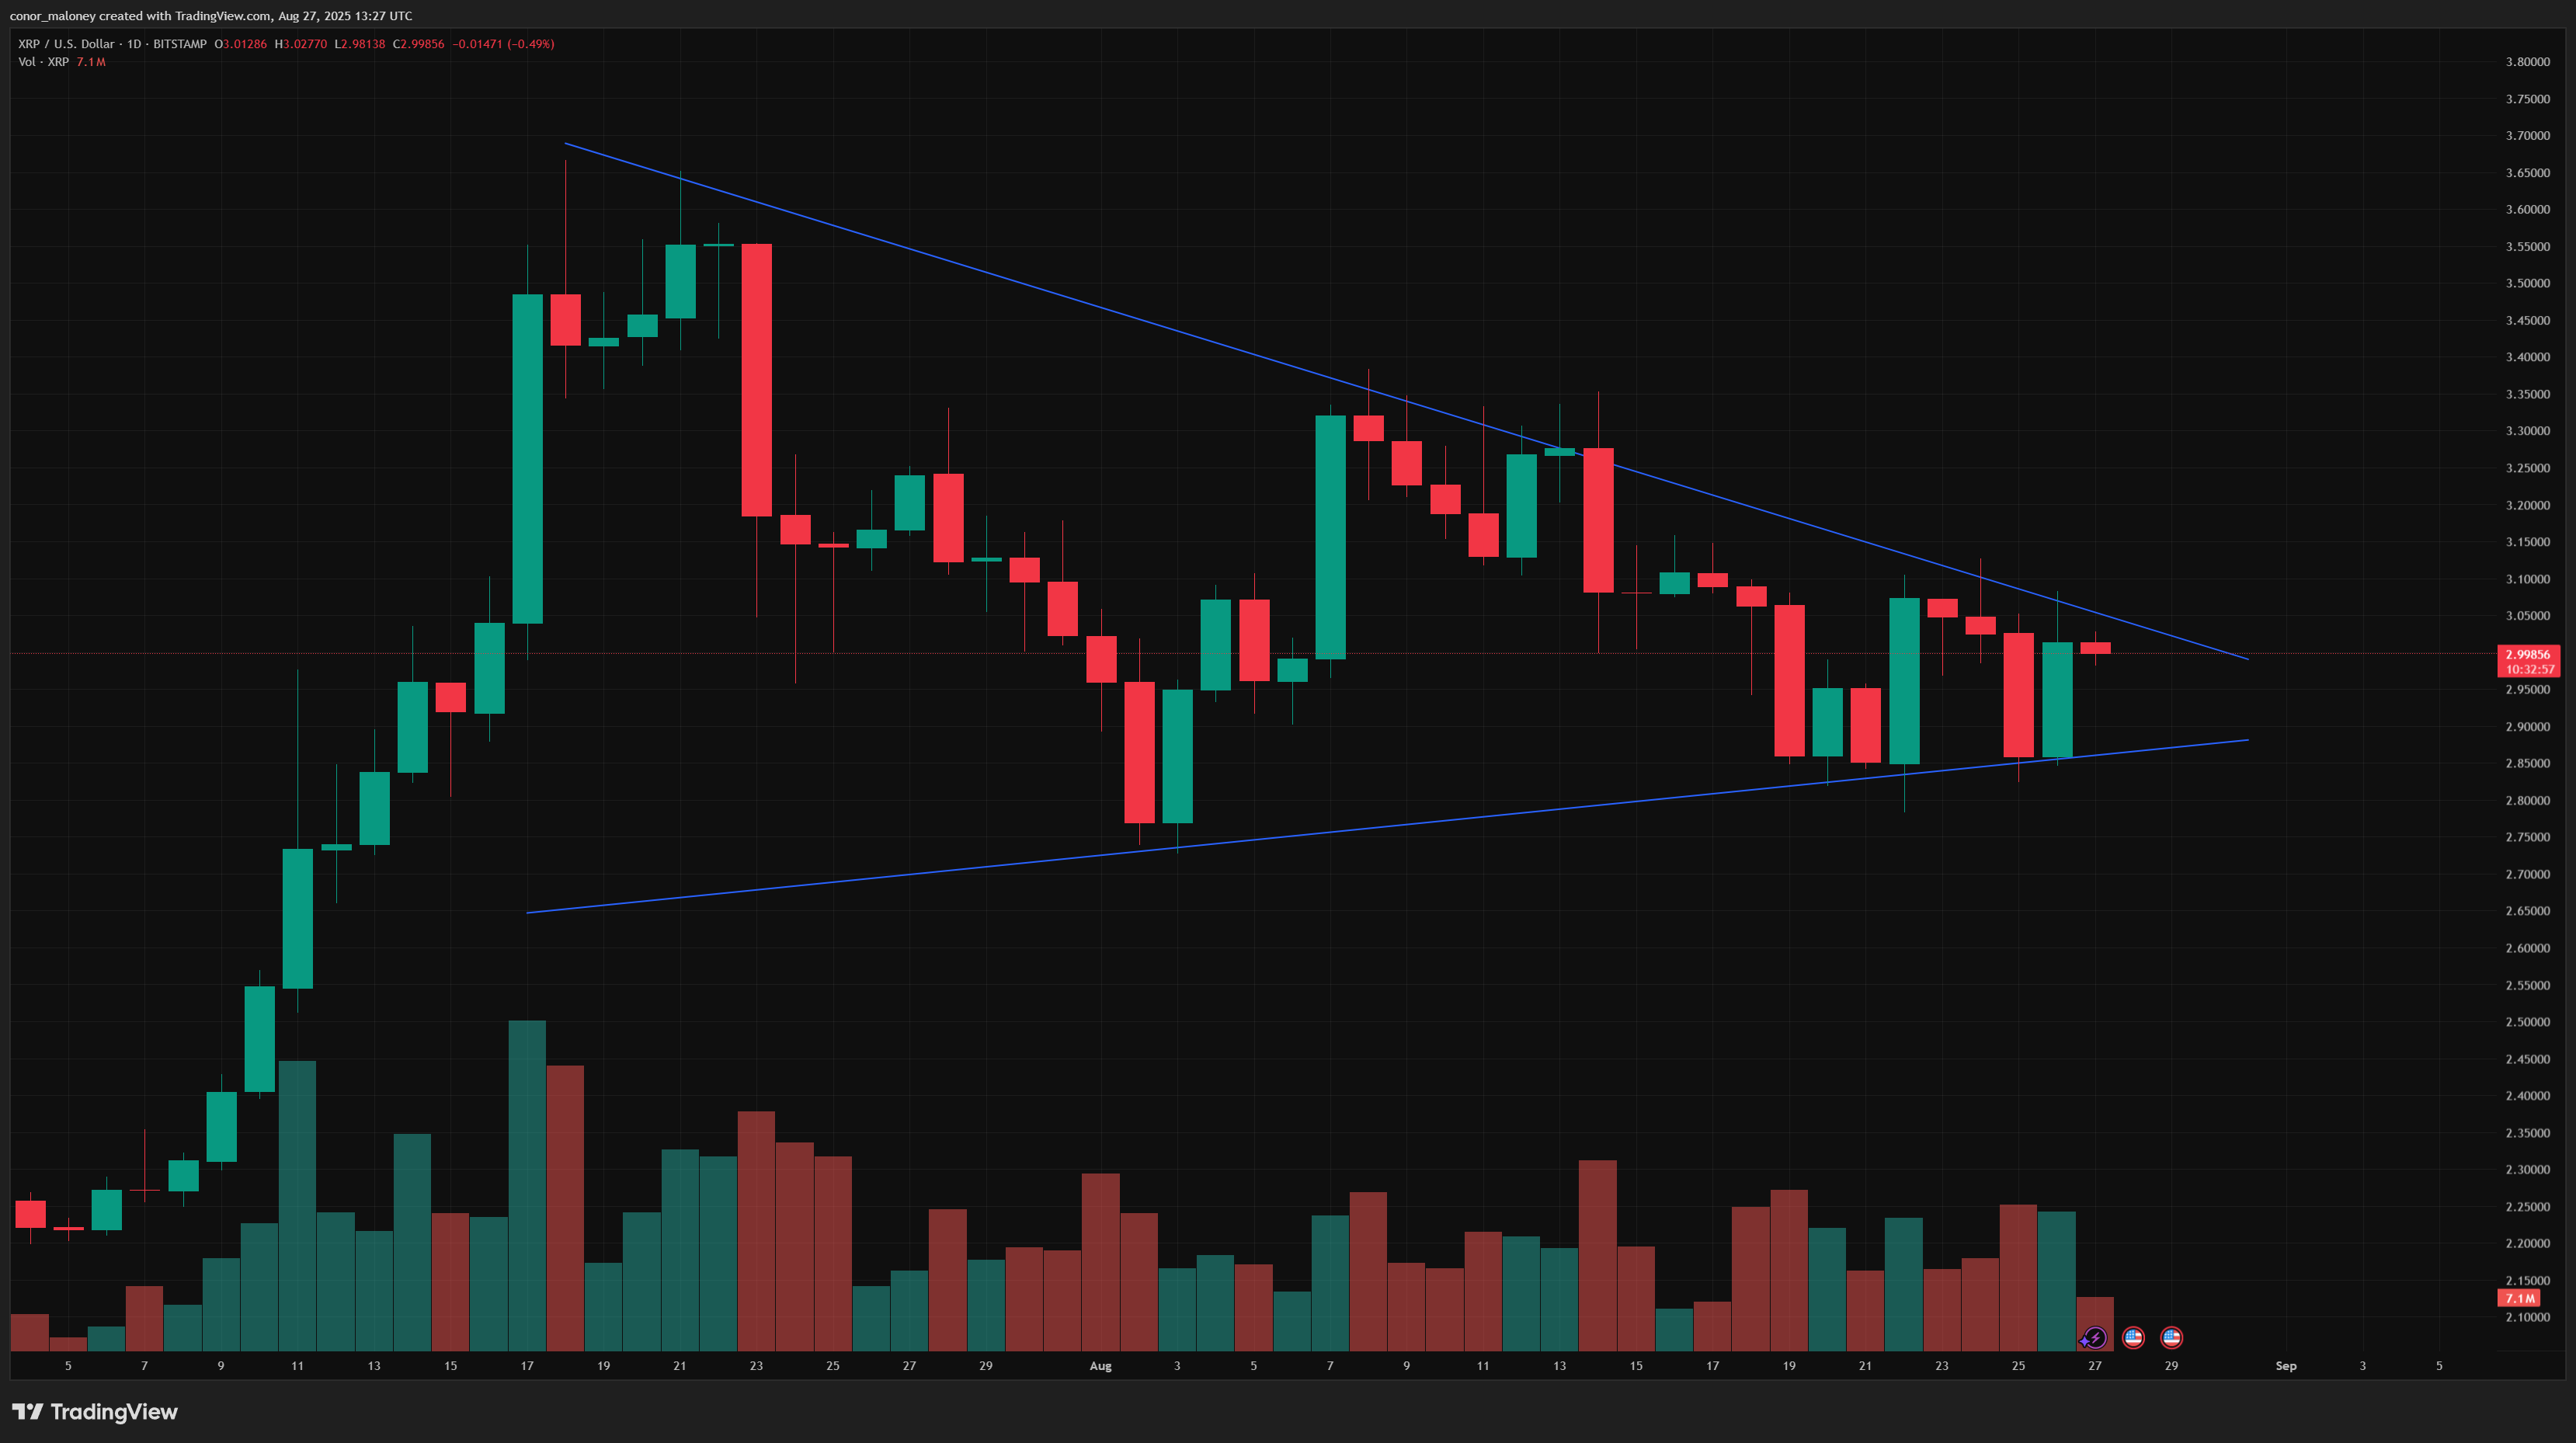
A textbook ascending triangle formation on the daily chart suggests mounting bullish pressure. Each higher low meets resistance at a key level, squeezing price action toward an inevitable breakout.
Volume confirms the narrative—steady accumulation on dips, fading sell-offs. Smart money isn't waiting around.
Timing the Breakout
Watch the confluence zone where descending trendline resistance meets horizontal price barriers. A daily close above that level could trigger algorithmic buying cascades—the kind that makes traditional finance folks complain about 'irrational exuberance' while counting their dividend yields.
Target zones come into focus once confirmation hits. Historical volatility profiles suggest this isn't just another false start.
Ripple's ecosystem developments add fundamental weight—liquidity solutions gaining traction while legacy systems still debate settlement times.
Risk remains, as always. Failed breakouts trap eager bulls. But patterns this clean don't form often. When they do, pay attention.
Current XRP price scenario
XRP is now trading at around $3.00, ranging from $2.90 to $3.06 in the last 24 hours. The symmetrical triangle pattern has been visible on the charts for well over a week, and today’s price action shows Ripple continuing to trade in an ever-tighter range after weeks of sideways action.
$3.00 is a crucial price point, right in the middle of the battleground for buyers and sellers.
XRP coin is consolidating after the upward price swing seen earlier this month which was triggered by the new SBI partnership with Ripple as well as the increased likelihood of interest rate cuts following the Jackson Hole speech by Fed Chair Jerome Powell.
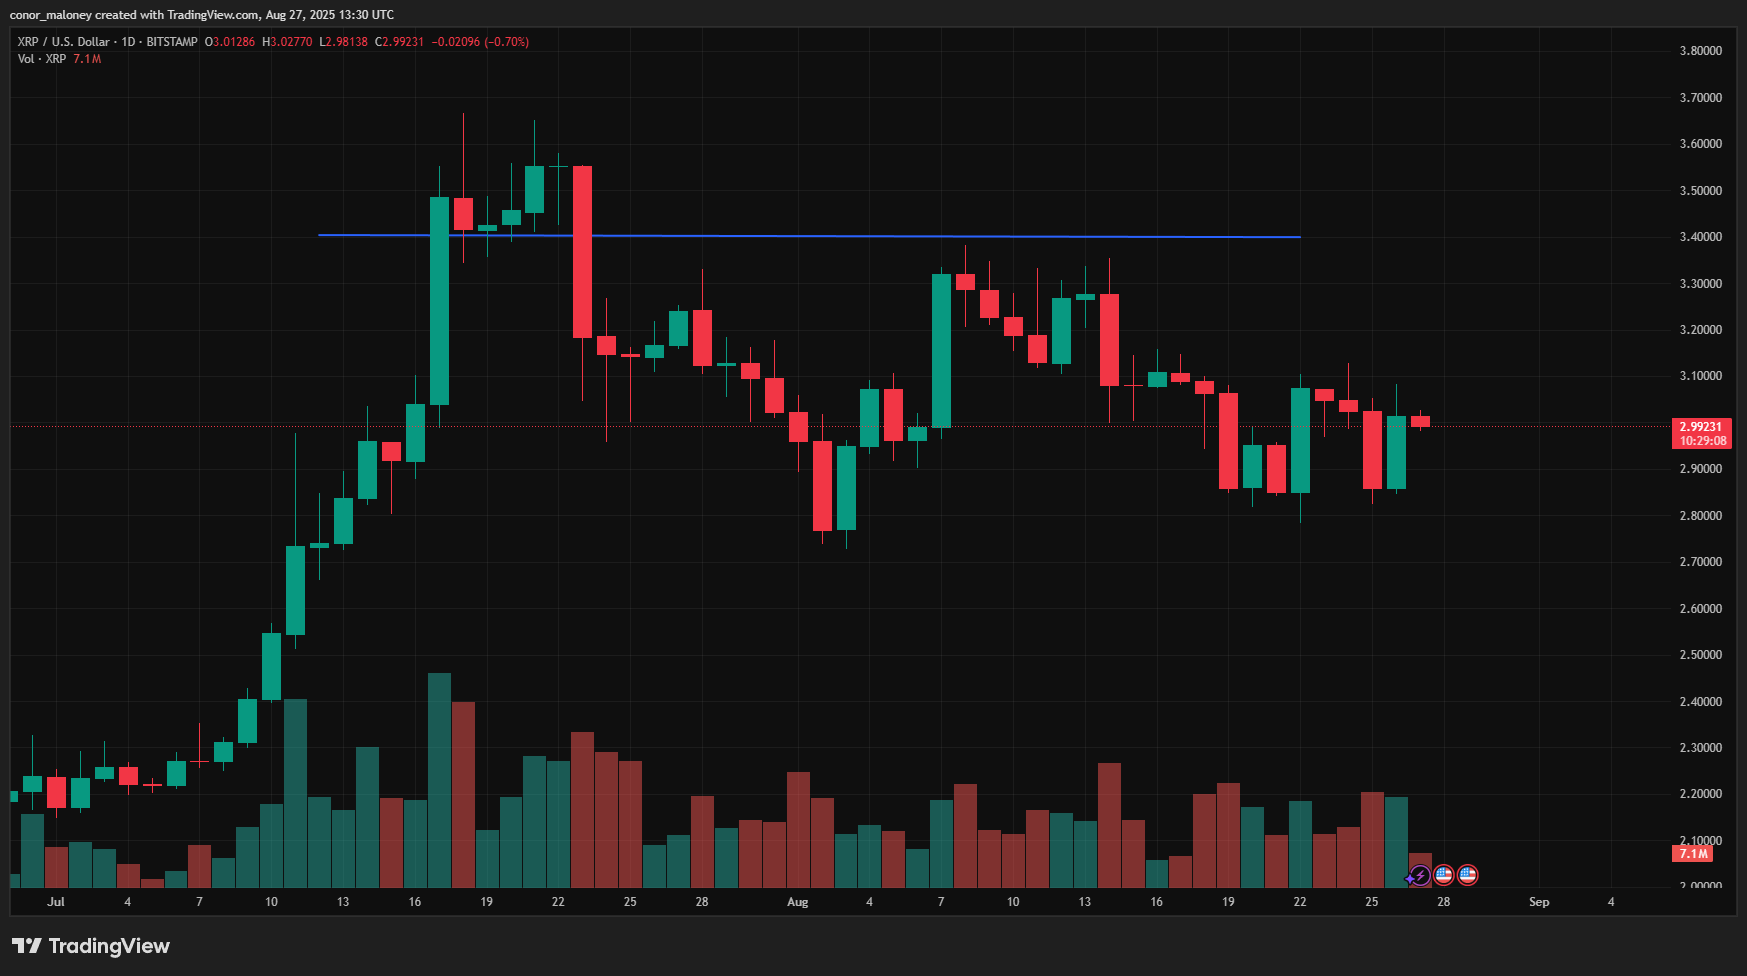
That move carried XRP into the $3 zone but sellers have stepped in to cap the advance. The result is a standoff, with buyers defending support NEAR $2.85 and sellers blocking progress above $3.05.
XRP price prediction: Upside Outlook
If XRP can clear $3.05 to $3.10 with conviction, the symmetrical triangle WOULD resolve upward. In that scenario, price targets in the $3.40 to $3.65 range come into focus, with analysts suggesting a possible run toward $4.50 or even $5.00 if momentum extends.
The bullish case is supported by steady institutional adoption and on-chain flows that continue to show accumulation despite the recent pause in price action. Retail enthusiasm also remains strong, keeping XRP firmly in the spotlight as one of the most actively traded altcoins.
XRP price scenario: Downside Risks
The bearish view is anchored on XRP’s repeated failures at the $3.05 level. Each rejection chips away at bullish momentum and keeps the token pinned within the triangle. If the market loses $2.85 support, the structure breaks down and price could slide to $2.74 or $2.66.
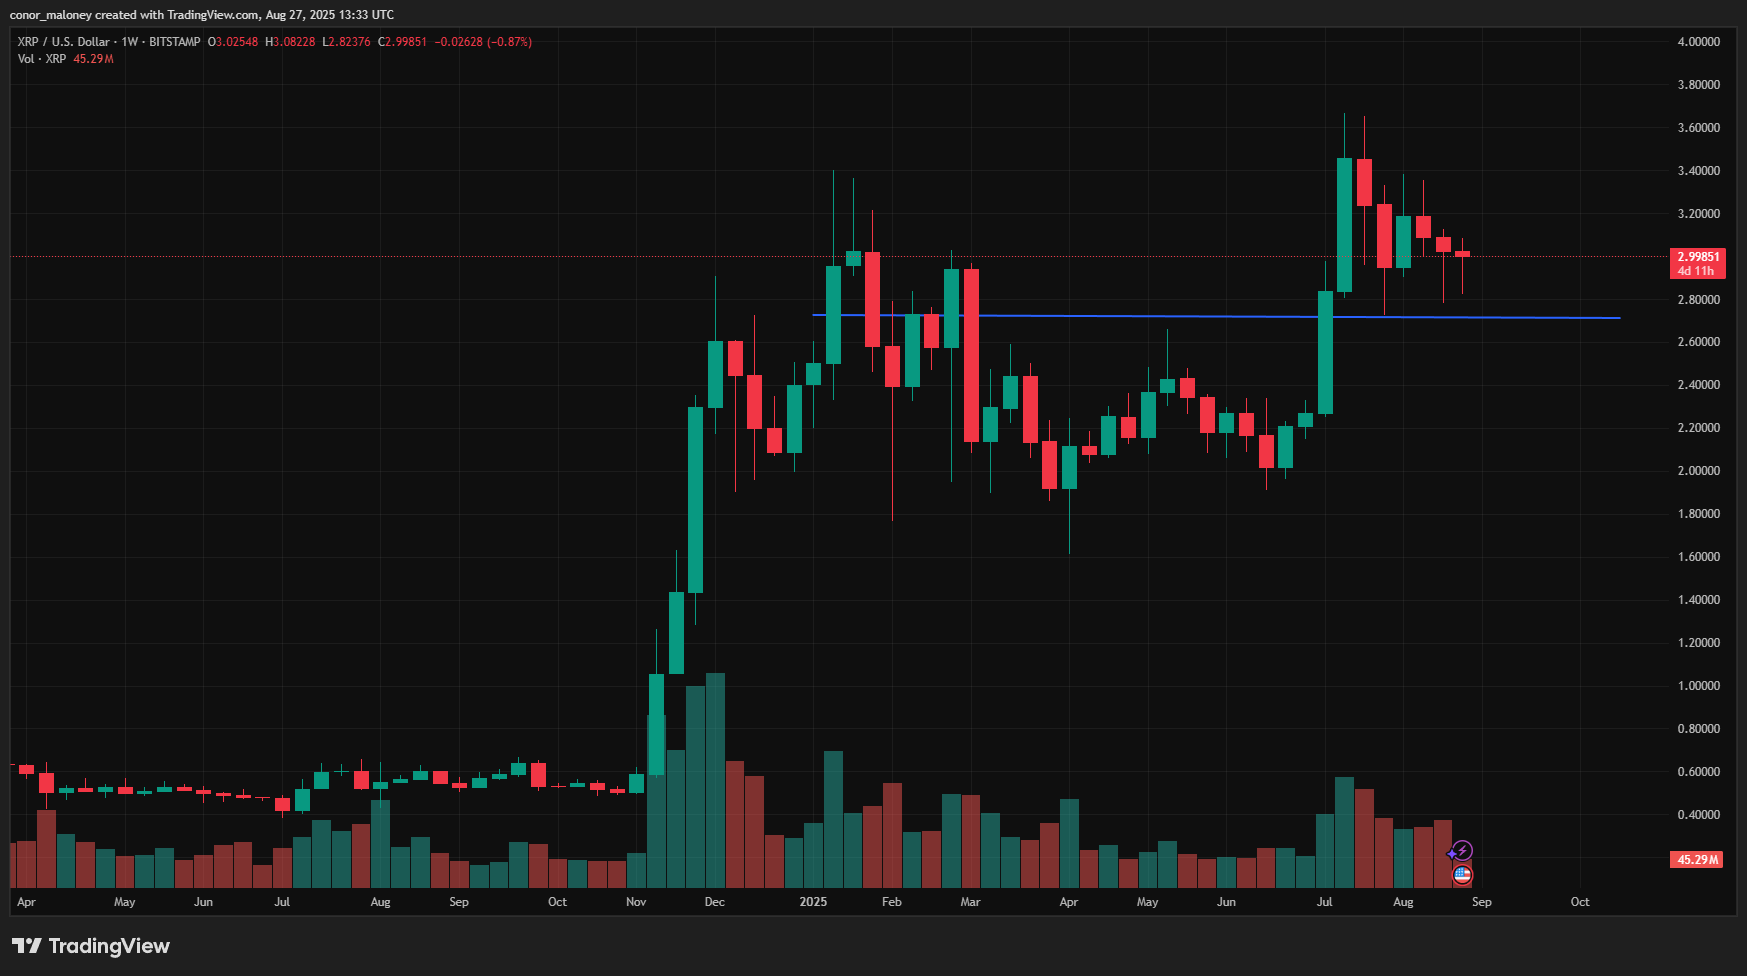
A more severe decline could push XRP toward $2.33. Broader crypto weakness, particularly following Bitcoin’s flash crash earlier this week, is another factor weighing on sentiment. The risk is that fragile conditions in majors drag XRP lower even if its own fundamentals remain steady.
XRP Price Prediction Based on Today’s Levels
For now, XRP is boxed in between $2.85 and $3.10. A MOVE above the upper line of resistance would confirm a bullish continuation with short-term targets at $3.30 to $3.40 and the possibility of extending higher. A failure of support at $2.85 would confirm a bearish projection into the mid-$2 region.
The symmetrical triangle is expected to resolve within the next seven to ten days, as price approaches the narrowing end of the formation. Because the pattern developed after an uptrend, the probabilities lean slightly toward an upward break, although the market still needs confirmation.
The outlook is balanced and the expectation is for volatility to return once one of these boundaries is finally breached.
Disclosure: This article does not represent investment advice. The content and materials featured on this page are for educational purposes only.

Log in to Reply
Log in to comment your thoughtsComments
Related Articles
|Square
Get the BTCC app to start your crypto journey
Get started today Scan to join our 100M+ users