Bitcoin Plunges to $111K, Flushing Out Short-Term Speculators as RSI Signals Imminent Relief Rally

Bitcoin's sharp correction just shook out the weak hands—and technical indicators suggest the pain might be ending.
RSI Points to Oversold Bounce
The Relative Strength Index dipped into oversold territory, flashing a classic buy signal that historically precedes substantial rebounds. Smart money watches these levels like hawks—while day traders panic-sell at the worst possible moment.
Market Flush Clears Speculative Froth
That drop to $111K wasn't just noise—it was a necessary purge of leverage-heavy positions. Short-term speculators got liquidated, creating healthier foundations for the next leg up. Because nothing cleanses a bloated market faster than a good old-fashioned margin call.
Relief Rally Incoming?
History says oversold conditions in Bitcoin rarely last long. The stage gets set for violent rebounds that leave slow-moving institutions scrambling. Just another day in crypto—where the only thing more predictable than volatility is Wall Street's inability to time it.
Bitcoin on-chain data shows a healthy reset
The recent drop appears to be displacing newer players rather than long-term holders, according to on-chain data. On an Aug. 27 analysis, CryptoQuant contributor Crazzyblockk noted that investors holding BTC for less than a month are sitting on average unrealized losses of -3.5%, prompting many to sell.
This is confirmed by a marked reduction in supply held by these short-lived addresses. Meanwhile, holders in the 1–6 month range remain in profit (+4.5%), showing little sign of stress. This indicates the sell-off is concentrated among recent entrants rather than across the broader short-term holder base.
According to Crazzyblockk, this kind of capitulation is “constructive,” as it redistributes coins from weaker hands to more resilient holders, strengthening Bitcoin’s foundation for the move.
Market pressure builds as Bitcoin buy/sell ratio weakens
Another CryptoQuant analyst, CryptoOnchain, flagged that Bitcoin’s 30-day moving average of the Taker Buy/Sell Ratio has dropped to its lowest point since May 2018. The ratio indicates persistent selling pressure when it drops below 0.98, and the current reading shows that the market is experiencing significant stress.
The concerning aspect is that this ratio is currently below what was observed at the previous peak of Bitcoin in November 2021. Although the price has increased, this divergence indicates that the underlying buy-side momentum is waning, making the market susceptible to additional short-term declines.
Bitcoin technical analysis
Chart indicators give a mixed picture. At 41, the Relative Strength Index is close to oversold territory and may provide some short-term relief. Additionally, the Commodity Channel Index shows a buy signal, indicating that bitcoin might be stabilizing.
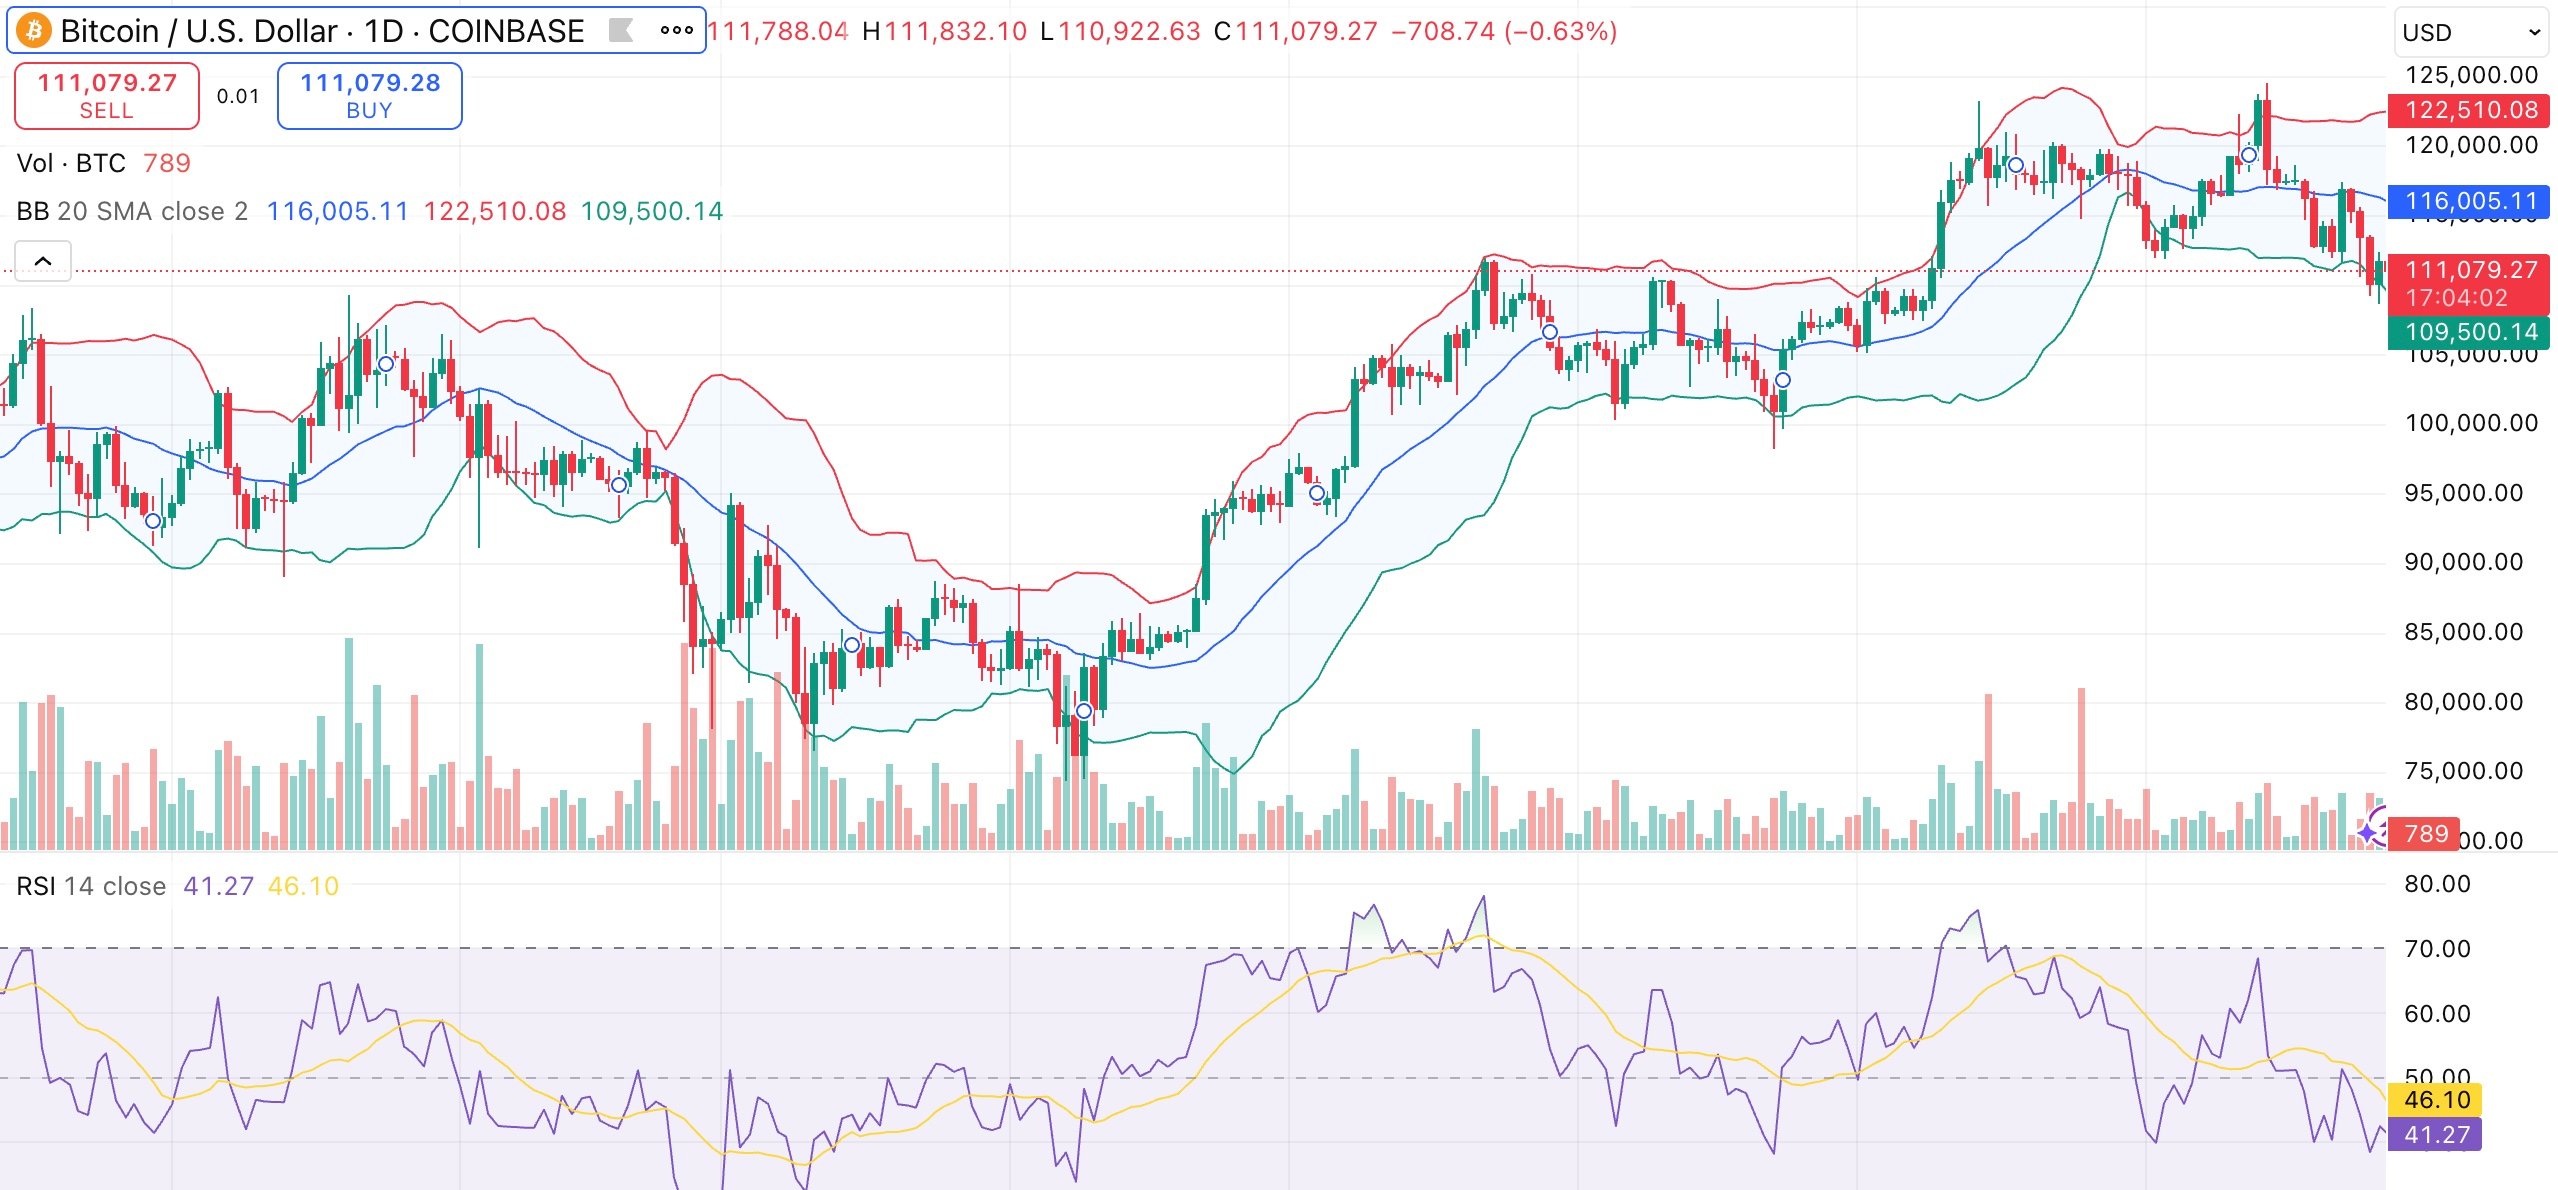
However, momentum and trend indicators remain bearish. The MACD and momentum both signal downside pressure. Moving averages are similarly tilted bearish. BTC trades below the 10-, 20-, 30-, and 50-day SMAs/EMAs, reinforcing a short-term downtrend.
On the positive side, Bitcoin continues to hold above its long-term support between its 100- and 200-day EMAs, which are approximately at $111,000 and $103,000, respectively.
If buyers step in around the $110,000–$111,000 range, RSI relief could push BTC back toward resistance NEAR $115,000–$117,000. A failure to hold the $110,000 level risks opening a path to the $107,000–$108,000 zone, with stronger support around $103,000 at the 200-day average.
