Ethereum Plunges After Shattering $4,900 ATH—Is a Brutal Crash Next?
Ethereum just nosedived from record-breaking heights—and traders are sweating bullets.
The Correction Nobody Saw Coming
ETH skyrocketed past $4,900, marking a historic peak before momentum slammed into reverse. Now, the pullback has everyone questioning whether this is a healthy reset or the start of something uglier.
Greed, Fear, and Classic Crypto Volatility
Market sentiment flipped fast—what felt like an unstoppable rally now looks fragile. Whales are cashing out, leverage is unwinding, and retail investors are left holding the bag—again. Typical crypto theater, really.
Will Support Levels Hold—Or Fold?
All eyes are on key price zones. If Ethereum can’t defend its recent gains, a deeper slide could follow. But if bulls step back in, this might just be another bump in the road to higher highs.
So, is Ethereum headed for a crash? Maybe. Or maybe Wall Street’s just shaking out weak hands before the next pump—because nothing makes traditional finance guys happier than watching crypto traders panic sell at a loss.
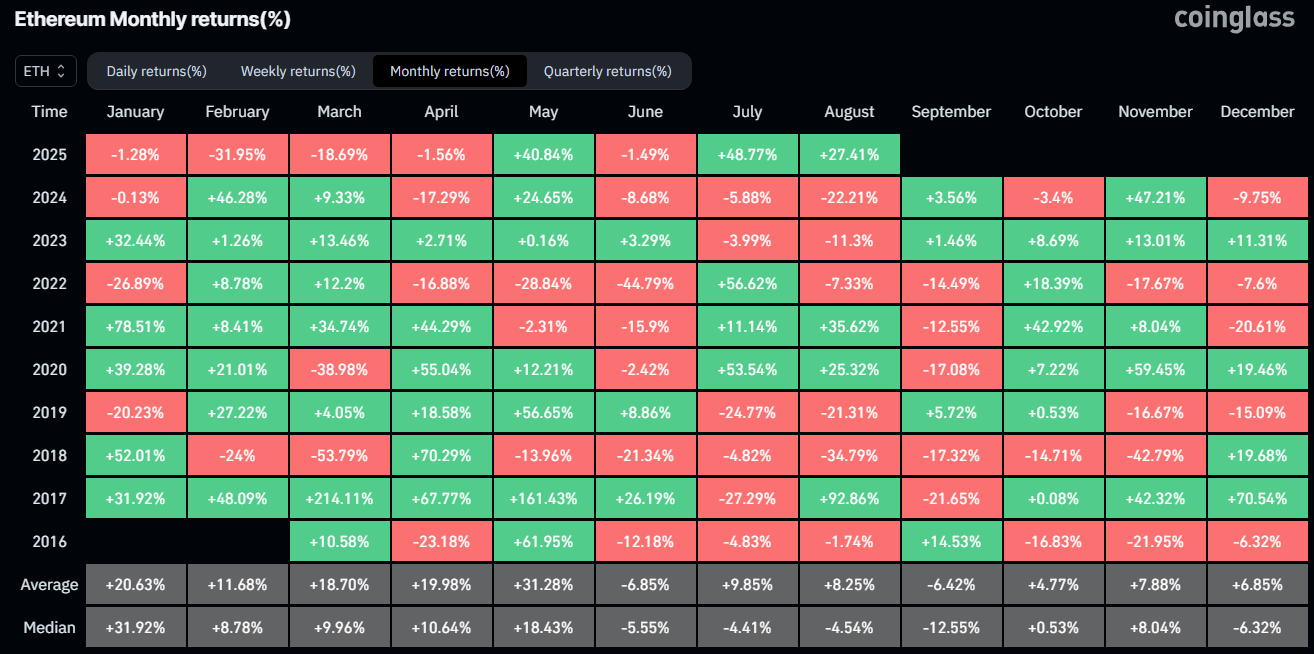
 ETH monthly price gains | Source: CoinGlass
Such a scenario is further supported by the fact that ETH remains close to its all-time high levels. Cryptocurrencies typically tend to face some sell-off after hitting a new peak, as early investors begin to book profits.
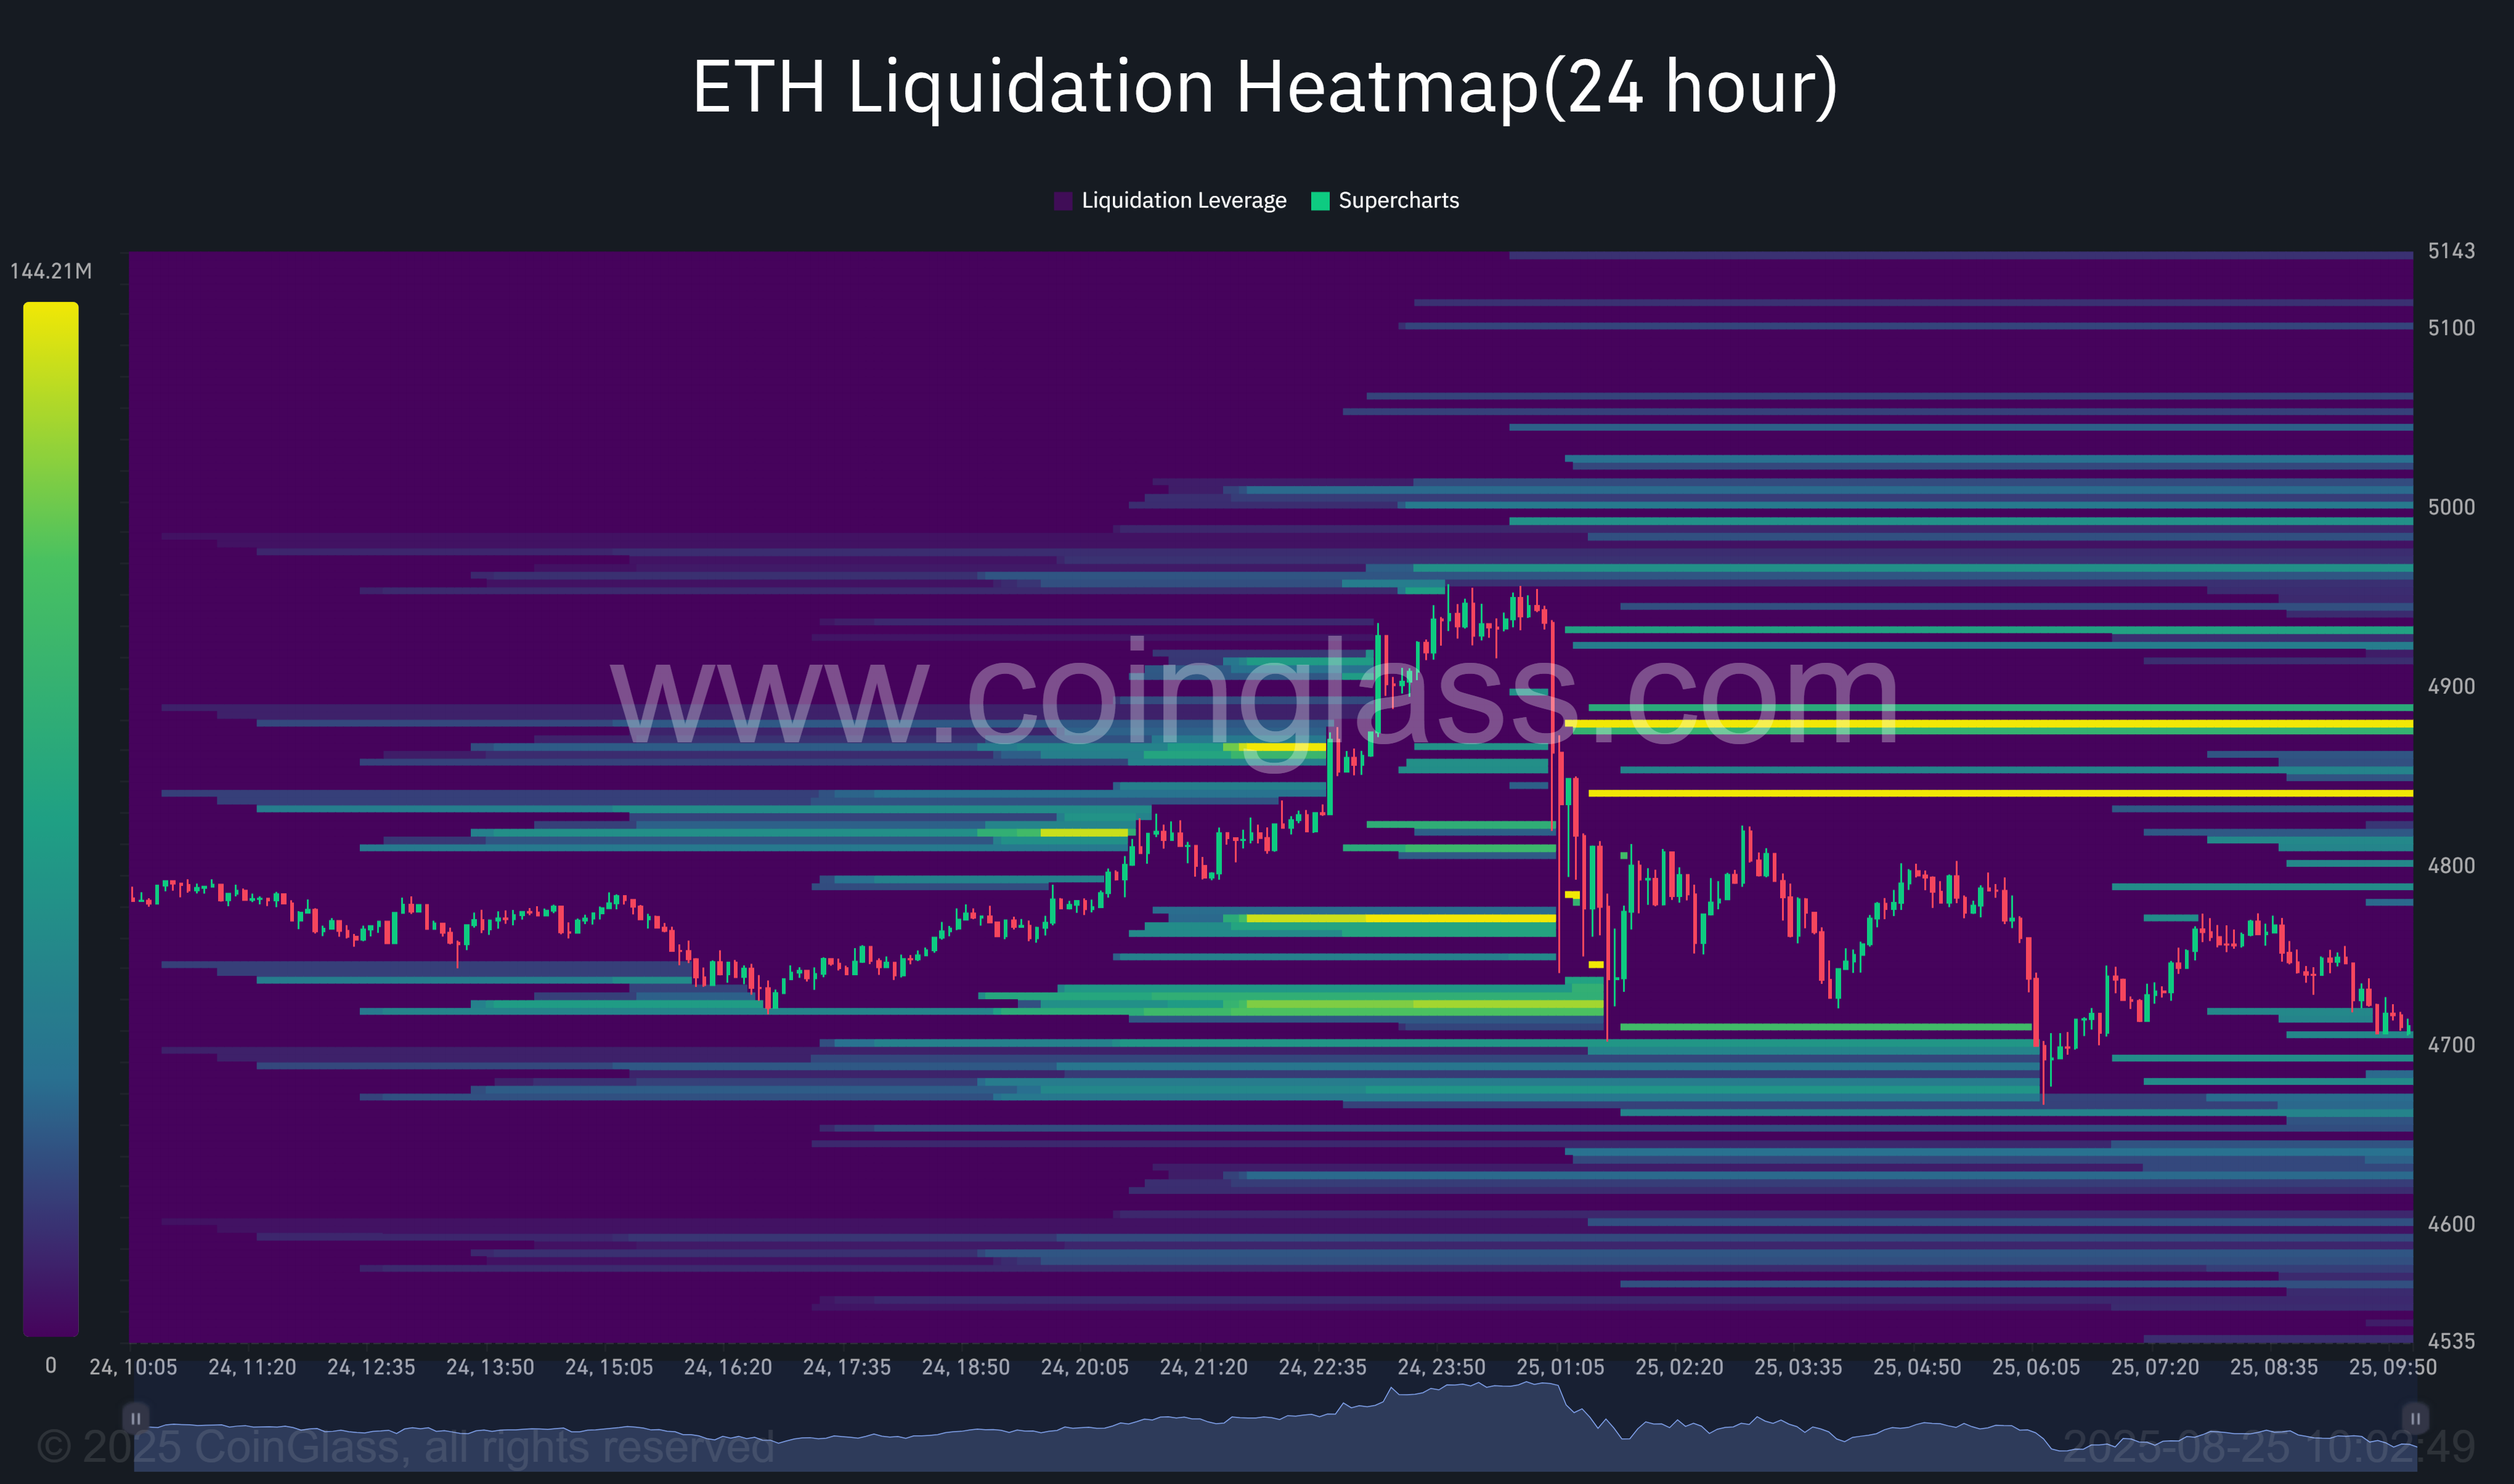
Meanwhile, data from CoinGlass shows that Ethereum’s sharp drop from its new high was triggered by a wave of long liquidations, as overleveraged positions were flushed NEAR the top. In the past 24 hours, total liquidations for ETH stood at $216 million, with nearly $130 million coming from long positions.

As of press time, dense liquidation zones remain clustered above $4,900. Any renewed attempt to break higher could spark another liquidation cascade. If this occurs, ETH may slip further toward the $4,600–$4,680 range.
Nevertheless, unlike in previous cycles, Ethereum could enter the coming September under a different macro environment, one marked by the presence of spot Ether ETFs and corporate treasuries holding ETH, both of which were absent during past August rallies.
The nine-spot Ether funds have attracted $2.79 billion in inflows in August, following $5.43 billion in the previous month, reflecting strong demand for Ether among institutional investors. This stands in contrast to their Bitcoin counterparts, which have seen outflows totaling $1.19 billion this month.
Adding to the shift in market dynamics, Ether has emerged as one of the most closely watched crypto assets this month, bolstered by regulatory momentum, and a wave of corporate accumulation.
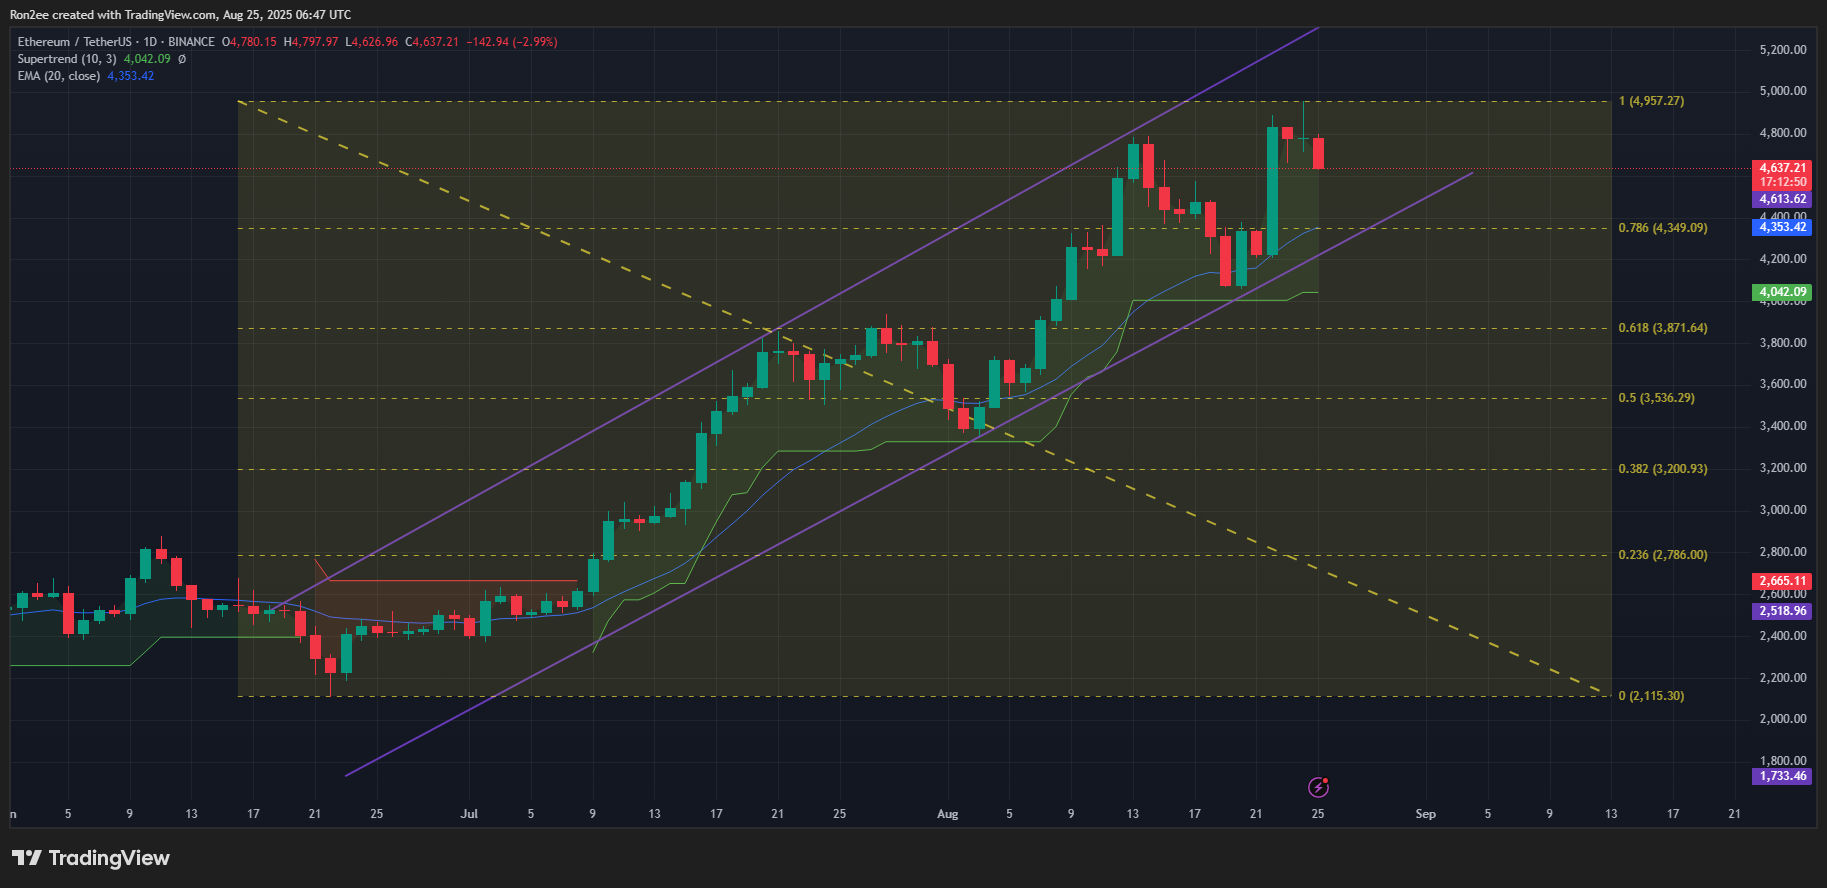
ETH price analysisOn the daily chart, Ethereum has been trading within an ascending parallel channel since late June, characterized by higher highs and higher lows within two upward-sloping trendlines. This structure typically signals a continuation of the prevailing bullish trend, provided price remains confined within the channel.

As of press time, Ethereum was consolidating near the midline of the channel, suggesting a period of equilibrium between buying and selling pressure. Notably, the token continues to trade above the 20-day exponential moving average, a sign that short-term momentum remains in favor of the bulls.
Additionally, the Supertrend indicator has flipped green and positioned itself below the price, offering another bullish confirmation.
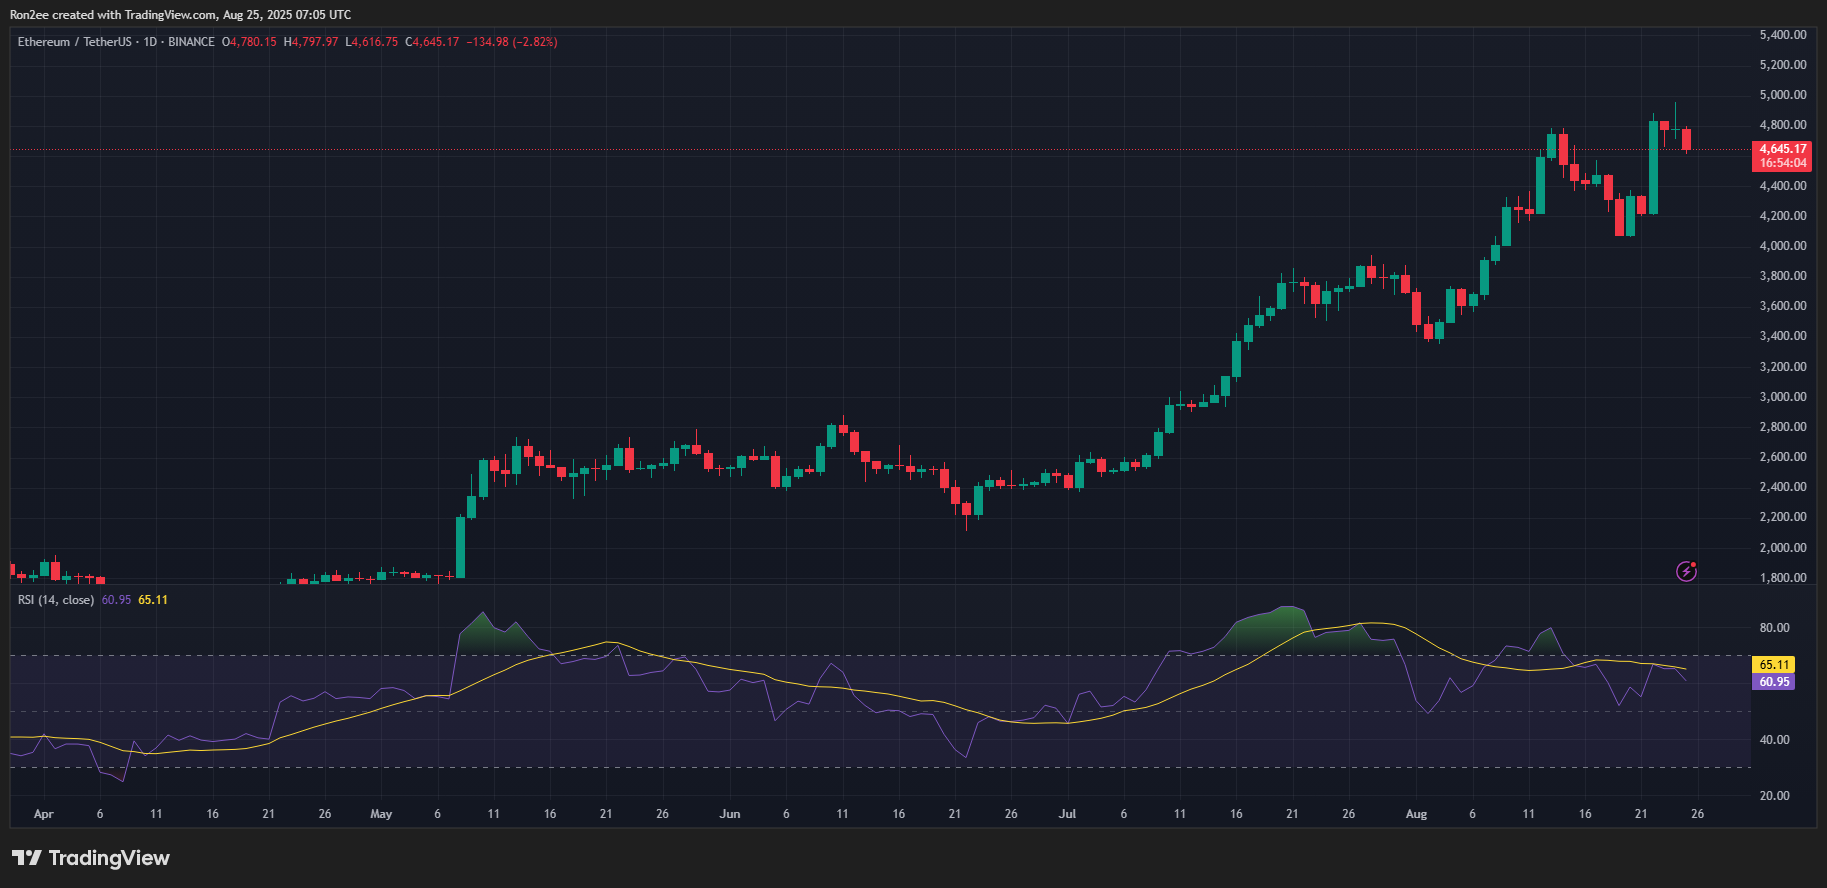
Meanwhile, the Relative Strength Index has dropped to a reading of 60, indicating that bullish momentum persists, but without entering overbought territory. This suggests that Ethereum still has room to advance before facing buyer exhaustion.

If bullish momentum continues, the next major upside target lies at $5,200, which represents a 10% gain from the current level and marks the upper boundary of the channel. A breakout above this level could accelerate further gains, particularly if accompanied by strong volume.
On the downside, immediate support is found at $4,349, a level that aligns with the 78.6% Fibonacci retracement of the most recent upward swing.
A break below this level WOULD invalidate the current pattern and could trigger a deeper correction toward the lower boundary of the channel.
Disclosure: This article does not represent investment advice. The content and materials featured on this page are for educational purposes only.

