Shiba Inu Price Nears Explosive Move as Whale Activity Dries Up

Whales vanish—Shiba Inu's price coils for a breakout.
The silence before the storm? Trading volume plunges as major holders retreat from SHIB markets. That eerie calm typically signals either a massive pump or devastating dump.
Market mechanics at play: Reduced whale activity often precedes volatility spikes. Retail traders left guessing whether this is accumulation or distribution.
Technical indicators flash neutral—no clear directional bias yet. But when liquidity thins out, moves get violent fast.
Remember: In crypto, the big players eat first while retail gets the crumbs—or the bill.
Shiba Inu price technical analysis
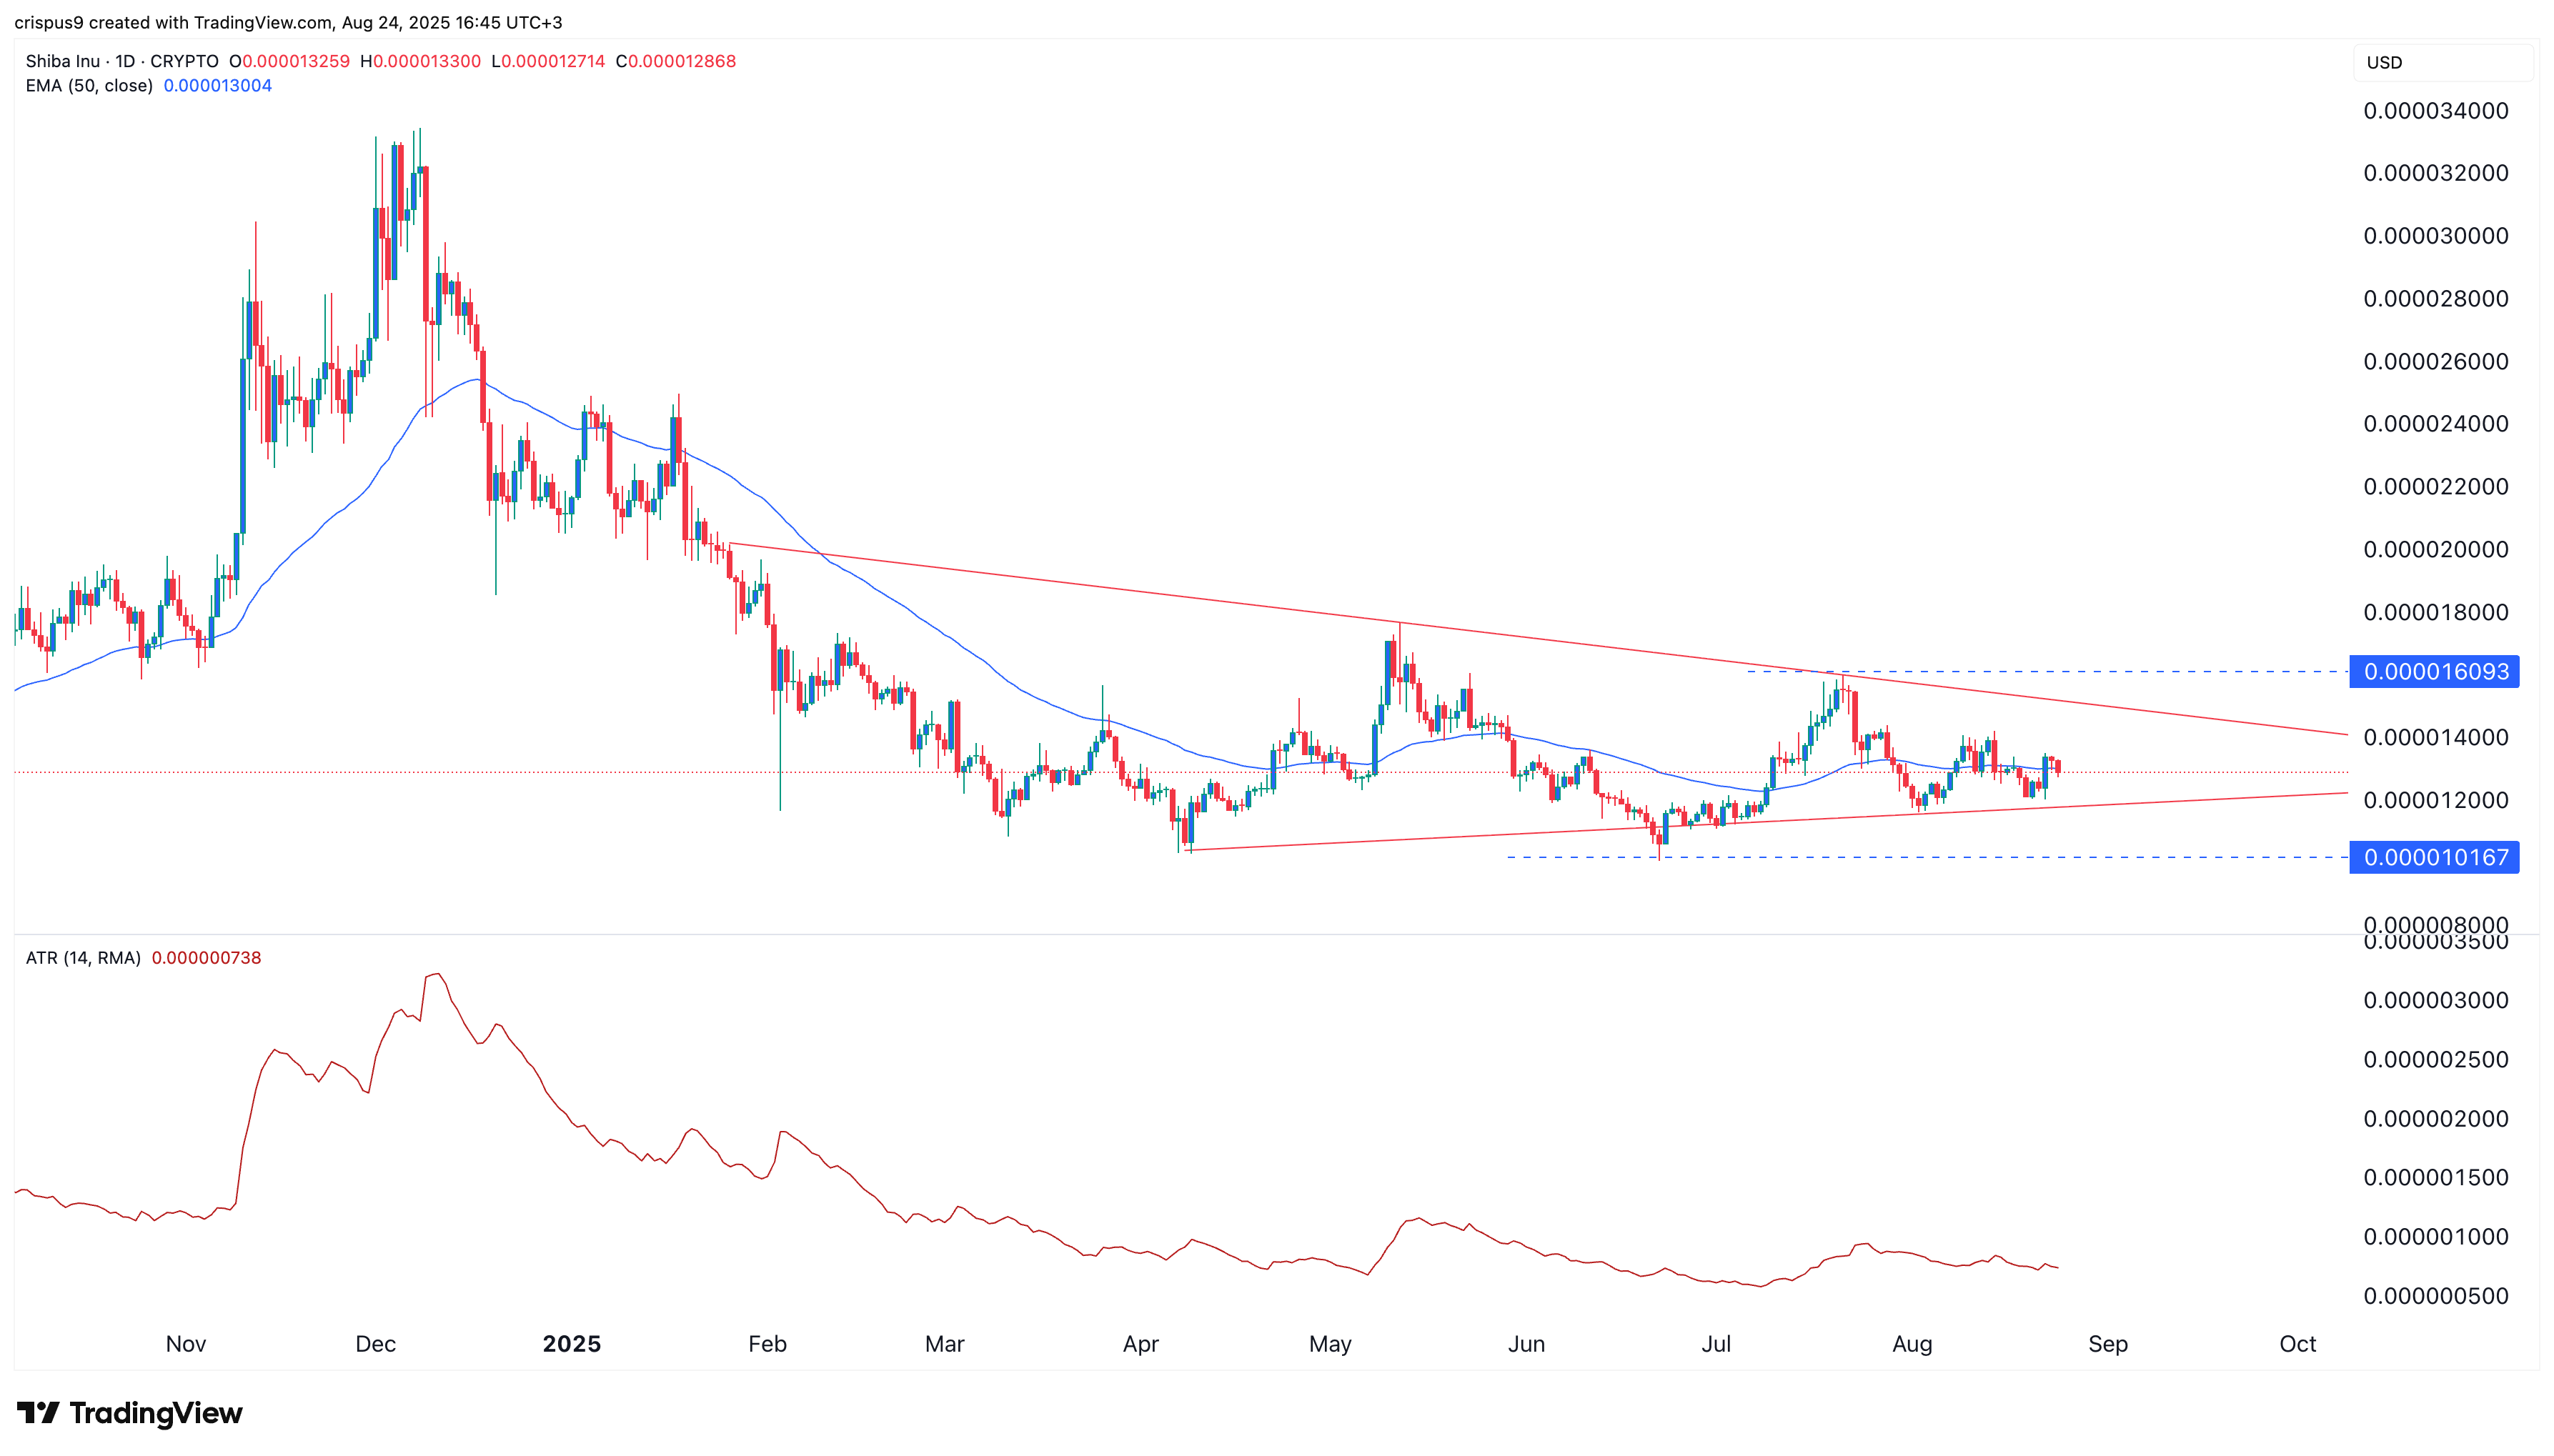
The daily timeframe chart indicates that the SHIB price has been moving sideways over the past few days. As a result, it has consolidated along the 50-day and 100-day Exponential Moving Averages, and its Average True Range has decreased, indicating low volatility.
The shiba inu price has also formed a symmetrical triangle pattern whose two lines are about to converge. In most cases, bullish or bearish breakouts happen when the two lines converge.
A bullish breakout will see it rise to the key resistance level at $0.00001600, its highest point on July 22. On the other hand, a drop could push it to $0.00001015, its lowest level in June.

Log in to Reply
Log in to comment your thoughtsComments
Related Articles
|Square
Get the BTCC app to start your crypto journey
Get started today Scan to join our 100M+ users