Ethereum Nears ’Danger Zone’ - But On-Chain Metrics Scream Bullish Breakout

Ethereum's price action flirts with technical danger levels while underlying blockchain data tells a completely different story.
On-Chain Strength Defies Price Anxiety
Network activity surges as transaction volumes hit multi-month highs. Active addresses spike while gas usage patterns suggest genuine utility demand—not just speculative transfers. Smart contract deployments accelerate, painting a picture of robust developer confidence despite short-term price uncertainty.
The Institutional Whisper
Whale accumulation patterns reveal sophisticated money positioning for the next leg up. Exchange outflows dominate as large holders move ETH into cold storage—classic bullish behavior that often precedes major moves. Staking yields remain attractive enough to lock up supply while traditional finance offers… well, whatever traditional finance offers these days.
Technical Peril Meets Fundamental Promise
Price charts show Ethereum testing critical support levels that could trigger cascading liquidations. Yet every on-chain metric screams accumulation phase. The divergence creates a tension that typically resolves violently in one direction. History favors the fundamentals.
When the charts say danger but the blockchain says opportunity, smart money bets on the code—not the candles.
Why Ethereum price hits new all-time high
Ethereum has surged more than 40% in 2025, outperforming Bitcoin, after reclaiming $4,000 in early August and surpassing $4,500 a few days later.
The rally is driven by strong inflows into spot ethereum ETFs—approved by the U.S. Securities and Exchange Commission (SEC) in July 2024 and now holding over $20 billion, led by BlackRock’s ETHA—as well as the rise of digital asset treasuries (DATs) centered on ether.
Ethereum ETFs also saw renewed inflows, adding $287 million on Thursday and more on Friday, bringing total ETF assets to $30.54 billion. Meanwhile, the Ethereum ecosystem shows strong activity, with stablecoin supply up 10% to $147 billion and total transactions rising to $880 billion, boosting project revenues.
Ethereum’s price is also rising due to growing expectations that the Federal Reserve may cut interest rates in September, following weaker-than-expected July jobs data and a higher unemployment rate.
A dovish Fed WOULD likely shift investment from low-risk bonds to riskier assets like crypto.
Ethereum hits ‘danger zone’— On-chain signals keep bulls hopping
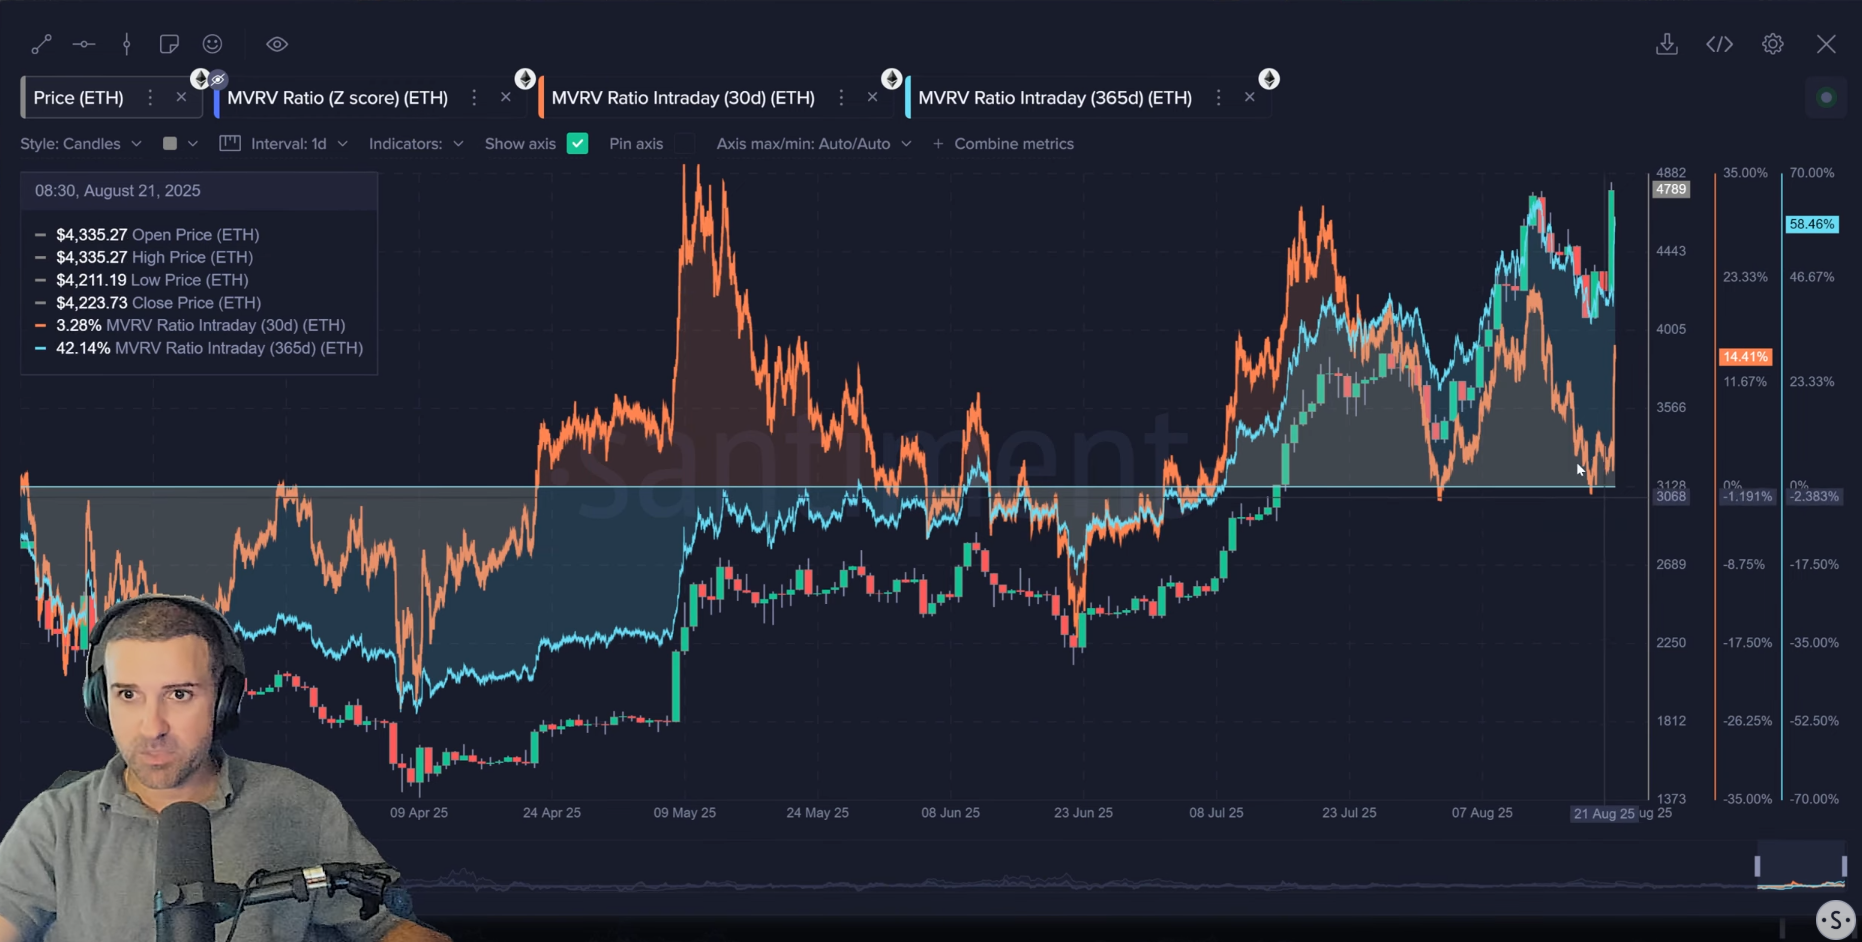
Santiment’s analysis points to concerning signals in Ethereum’s Market Value to Realized Value (MVRV) ratio. The short-term 30-day MVRV is approaching 15%, a level the analytics firm identifies as a “danger zone” where altcoins frequently face pullbacks.
The long-term MVRV currently stands at 58.5%. This elevated reading suggests current holders are sitting on substantial unrealized profits. This raises the likelihood of selling pressure if ETH breaks through resistance levels.
MVRV ratios measure the difference between market cap and realized cap. When these ratios reach extreme levels, they often precede price corrections as investors take profits.
The 15% threshold has historically marked turning points for Ethereum, with past instances coinciding with price declines that ranges from 10% to 25%.
Bullish on-chain signals counter the valuation warning
Other on-chain metrics paint a more optimistic picture for Ethereum’s long-term prospects. The mean dollar invested age is dropping sharply. This shows that previously dormant coins are moving back into active circulation.
Network realized profits are also spiking, which shows increased trading activity across the network. This measures the total profit realized by all coins moved on-chain, providing insight into market sentiment.
Most bullishly, the supply of ETH held on exchanges continues to decline. This trend suggests investors prefer self-custody storage over keeping tokens on trading platforms.
The exchange supply metric has been trending downward for months, with investors moving holdings to cold storage wallets. This behavior often correlates with price appreciation as it reduces readily available supply for trading.
