Bitcoin Plunges to $112K as Retail Panic-Sells While Whales Gobble Up Discounts

Bitcoin's floor just dropped to $112,000—and the little guys are bailing while the big players feast.
Retail Exodus Meets Whale Feeding Frenzy
Small investors hit the sell button hard, spooked by the sudden dip. Meanwhile, crypto whales—those holding massive bags—see blood in the water and keep stacking sats. They’re buying the fear, plain and simple.
Market Psychology at a Crossroads
Panic selling meets strategic accumulation. It’s a classic tale of two markets: one driven by emotion, the other by cold, calculated opportunity. Retail traders often sell low; whales rarely do.
Just another day in crypto—where the rich get richer, and everyone else overreacts to a 10% drop like it’s the apocalypse. Welcome to decentralized finance, same as the centralized version.
Retail demand fades while Bitcoin whales step in
According to an Aug. 21 post on X by CryptoQuant analyst Maartunn, retail demand fell 5.7% over the past week. He described smaller buyers as “tourists” who are quick to leave when prices turn volatile.
Retail has already left. 🤔
🔹️Retail Demand Change sits at -5.7%.
They're the tourists of the crypto market here for the hype, gone when it fades. pic.twitter.com/qiu0aXJpxB
Maartunn also noted that Bitcoin has now retested the $112,000 zone, its former record high, twice in a short span. He cautioned that repeated retests often weaken support and can foreshadow deeper losses.
Yet large holders appear to be taking the opposite view. CryptoQuant contributor Caueconomy, in an Aug. 22 analysis, reported that whales purchased over 16,000 BTC in the past seven days. Similar accumulation preceded a brief rebound earlier this month, suggesting that some investors may view the current levels as a buying opportunity.
On-chain signals point to early BTC market reset
Short-term holders who purchased between $113,000 and $120,000 are currently sitting at slight losses, according to data shared by Glassnode on Aug. 21. At the moment, their Spent Output Profit Ratio falls between 0.96 and 1.01.
The Anatomy of a Local Bottom
1- When the market enters a post-ATH contraction phase, short-term price action is often shaped by how top-buyers react to growing unrealized losses.
Right now, a dense cluster of supply, accumulated between $113k and $120k since early July,… pic.twitter.com/qn7CMnBJcH
In the past, local bottoms tend to FORM when this ratio dips closer to 0.9, indicating deeper capitulation. Current readings imply that the market is in the early stages of a possible reset, even though they do not confirm a bottom.
Bitcoin price technical analysis
Bitcoin is testing the lower edge of its Bollinger Bands, often a sign of oversold conditions but also a warning of heightened volatility. At 42, the Relative Strength Index is neutral but on the decline. Momentum indicators are bearish, with the MACD showing a negative crossover and short-term moving averages (10–50 day) indicating continuous pressure.
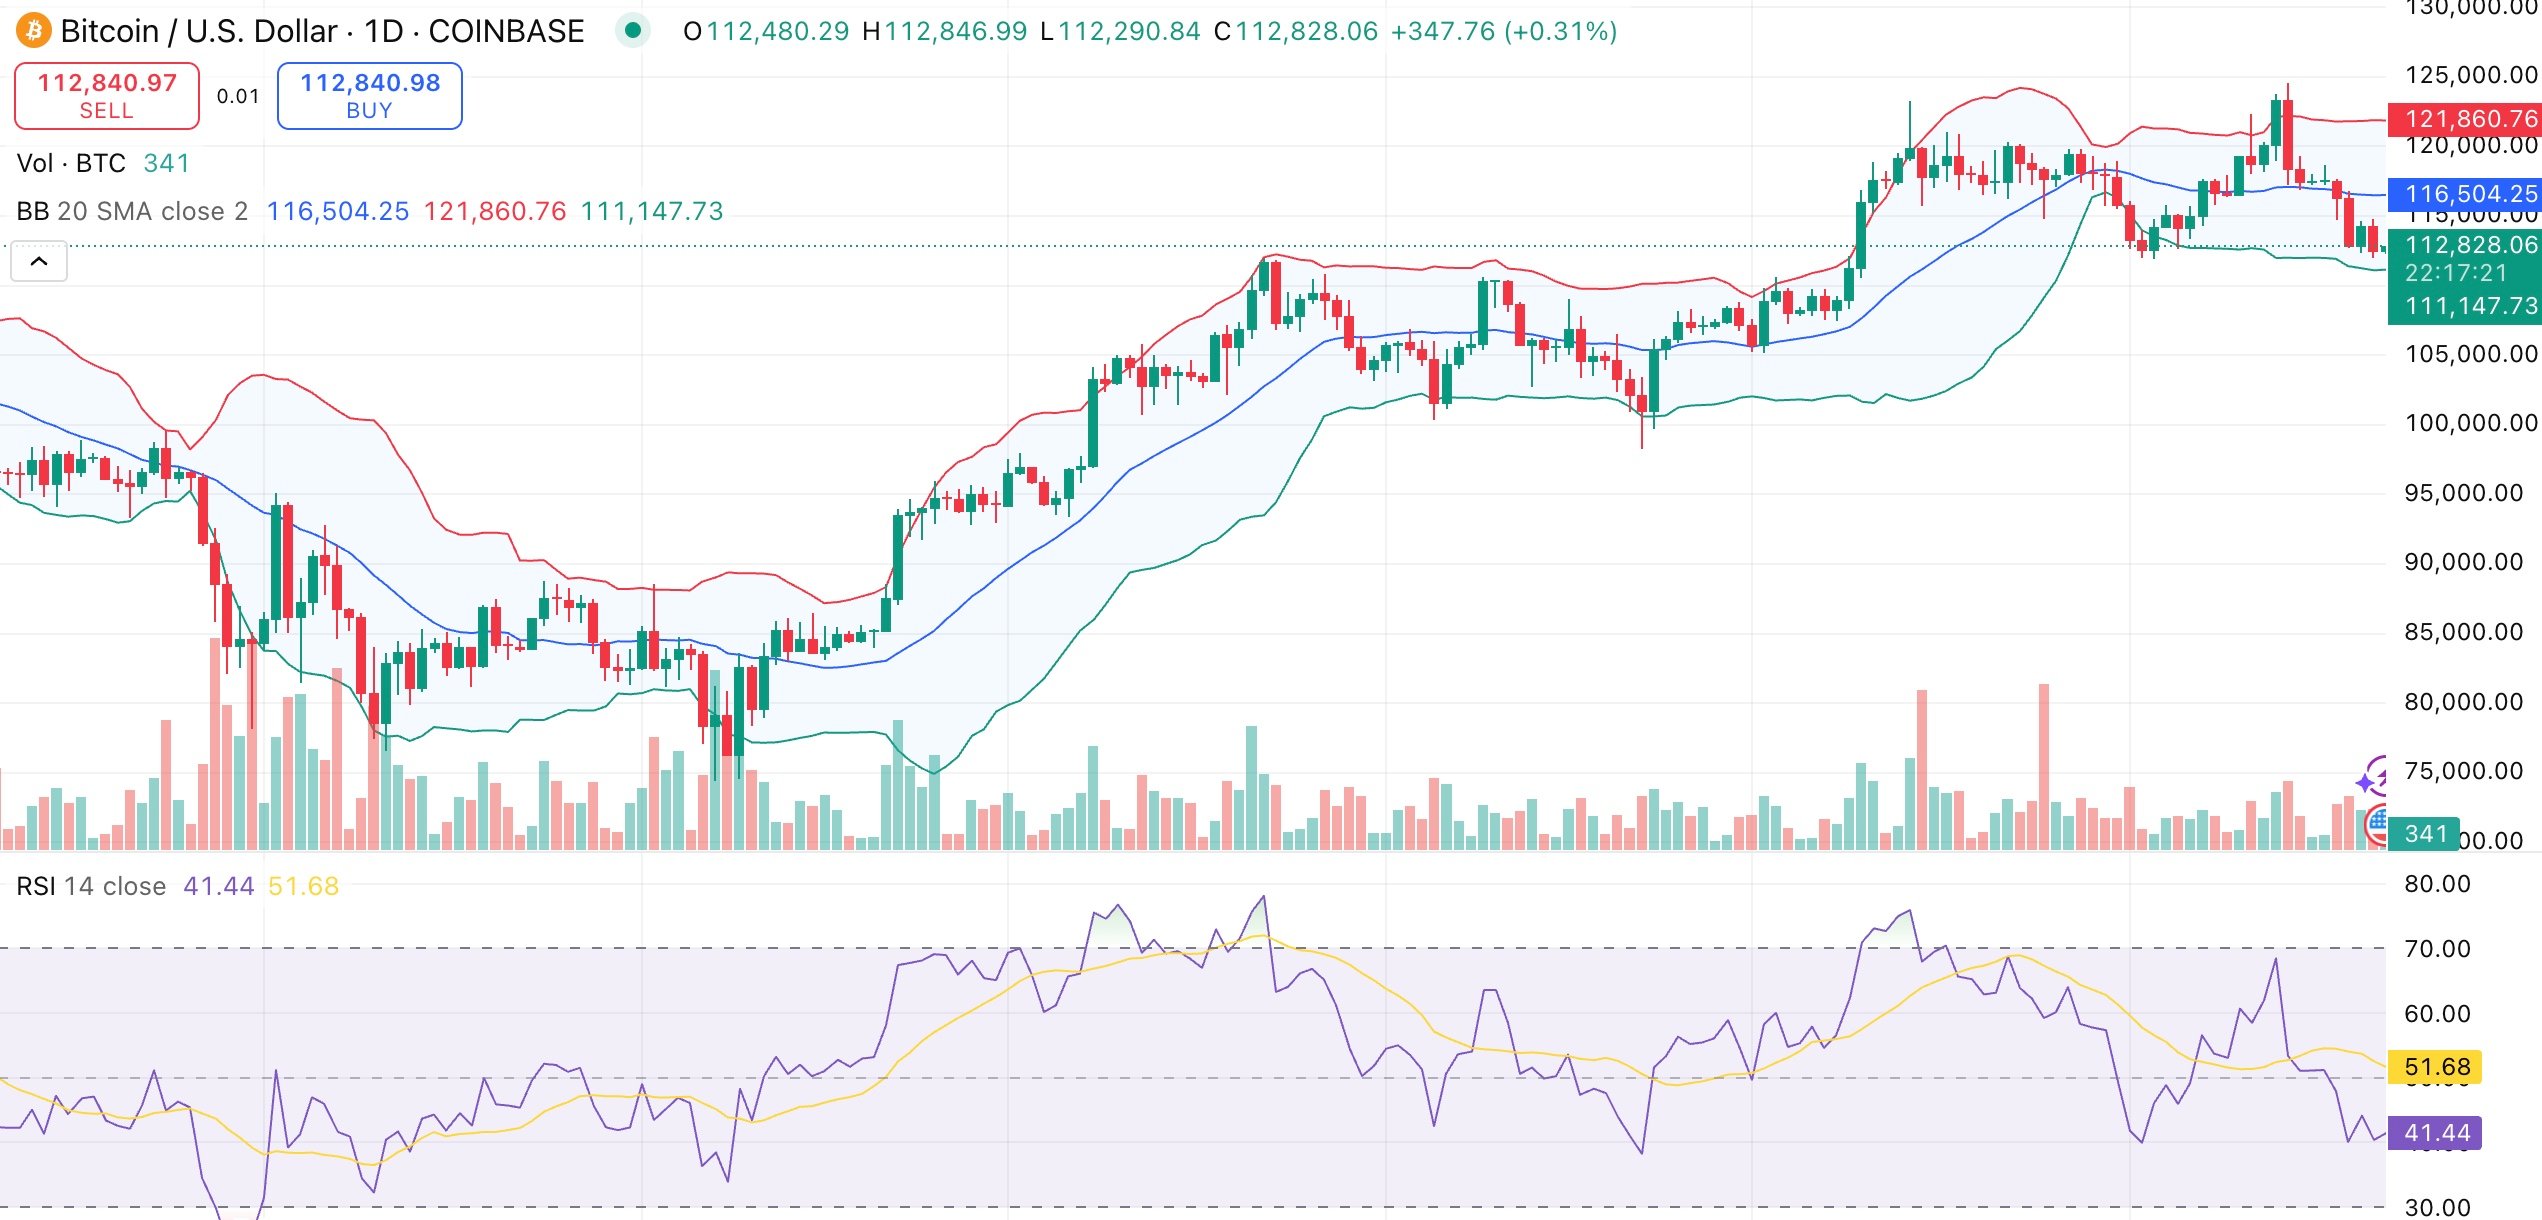
Longer-term moving averages (100 and 200 day) continue to be supportive, highlighting Bitcoin’s overall upward trend. Oscillators like the Williams percentage rate and stochastic RSI suggest that there might be a chance for a short recovery.
If whales continue to accumulate and the $112,000 support holds, bitcoin might try to recover towards $118,000. If this level is not held, it may reach the next crucial support zone, which is in the $105,000–$108,000 range.
