Ethereum Primed for 55% Rally as 14-Week ETF Accumulation Fuels Bullish Momentum

Ethereum's price trajectory is flashing bullish signals as institutional money pours into ETH ETFs—again proving Wall Street only embraces decentralization after it's been safely wrapped in a SEC-approved bow.
The 14-week accumulation streak suggests big players are positioning for a breakout, with technicals pointing to a potential 55% surge. But let's be real—when have crypto markets ever followed the script?
Key drivers: ETF inflows are creating buy-side pressure while the staking yield narrative gains traction. Though if history's any guide, the real fireworks will start when retail FOMO kicks in.
Proceed with cautious optimism—the same institutions currently accumulating will be first to dump when volatility spikes. Such is the cycle of crypto 'adoption'.
Ethereum ETF inflows surge
Ethereum (ETH) token retreated to $4,410 on August 16, down over 10% from its highest point this week. It remains 217% above the lowest level in April, and its strong fundamentals and technicals point to a 55% surge
American institutional and retail investors continued accumulating ethereum this week. SoSoValue data shows that these funds added $2.8 billion, much higher than Bitcoin’s (BTC) $547 million. It was the fourth week that Ethereum ETFs added more money than Bitcoin.
ETH ETFs now hold $30 billion in assets, with BlackRock’s ETHA leading the way with $15.9 billion. Its daily traded volume on Friday surged to $2.4 billion, a sign of the rising demand. The other top Ethereum funds are from Grayscale, Fidelity, and Bitwise.
Ethereum ETFs have added assets because of its robust growth across various areas in the crypto industry. It maintains a 68% market dominance in the decentralized finance industry, with its total value locked jumping to $203 billion.
Similarly, Ethereum’s stablecoin growth has accelerated recently. Its stablecoin supply has increased by 10% over the last 30 days to $144 billion, while the number of addresses has risen by 30% to 2.6 million.
Ethereum’s average transaction volume soared to $878 billion in the same period, much higher than TRON (TRX) $664 billion.
Ethereum price technical analysis
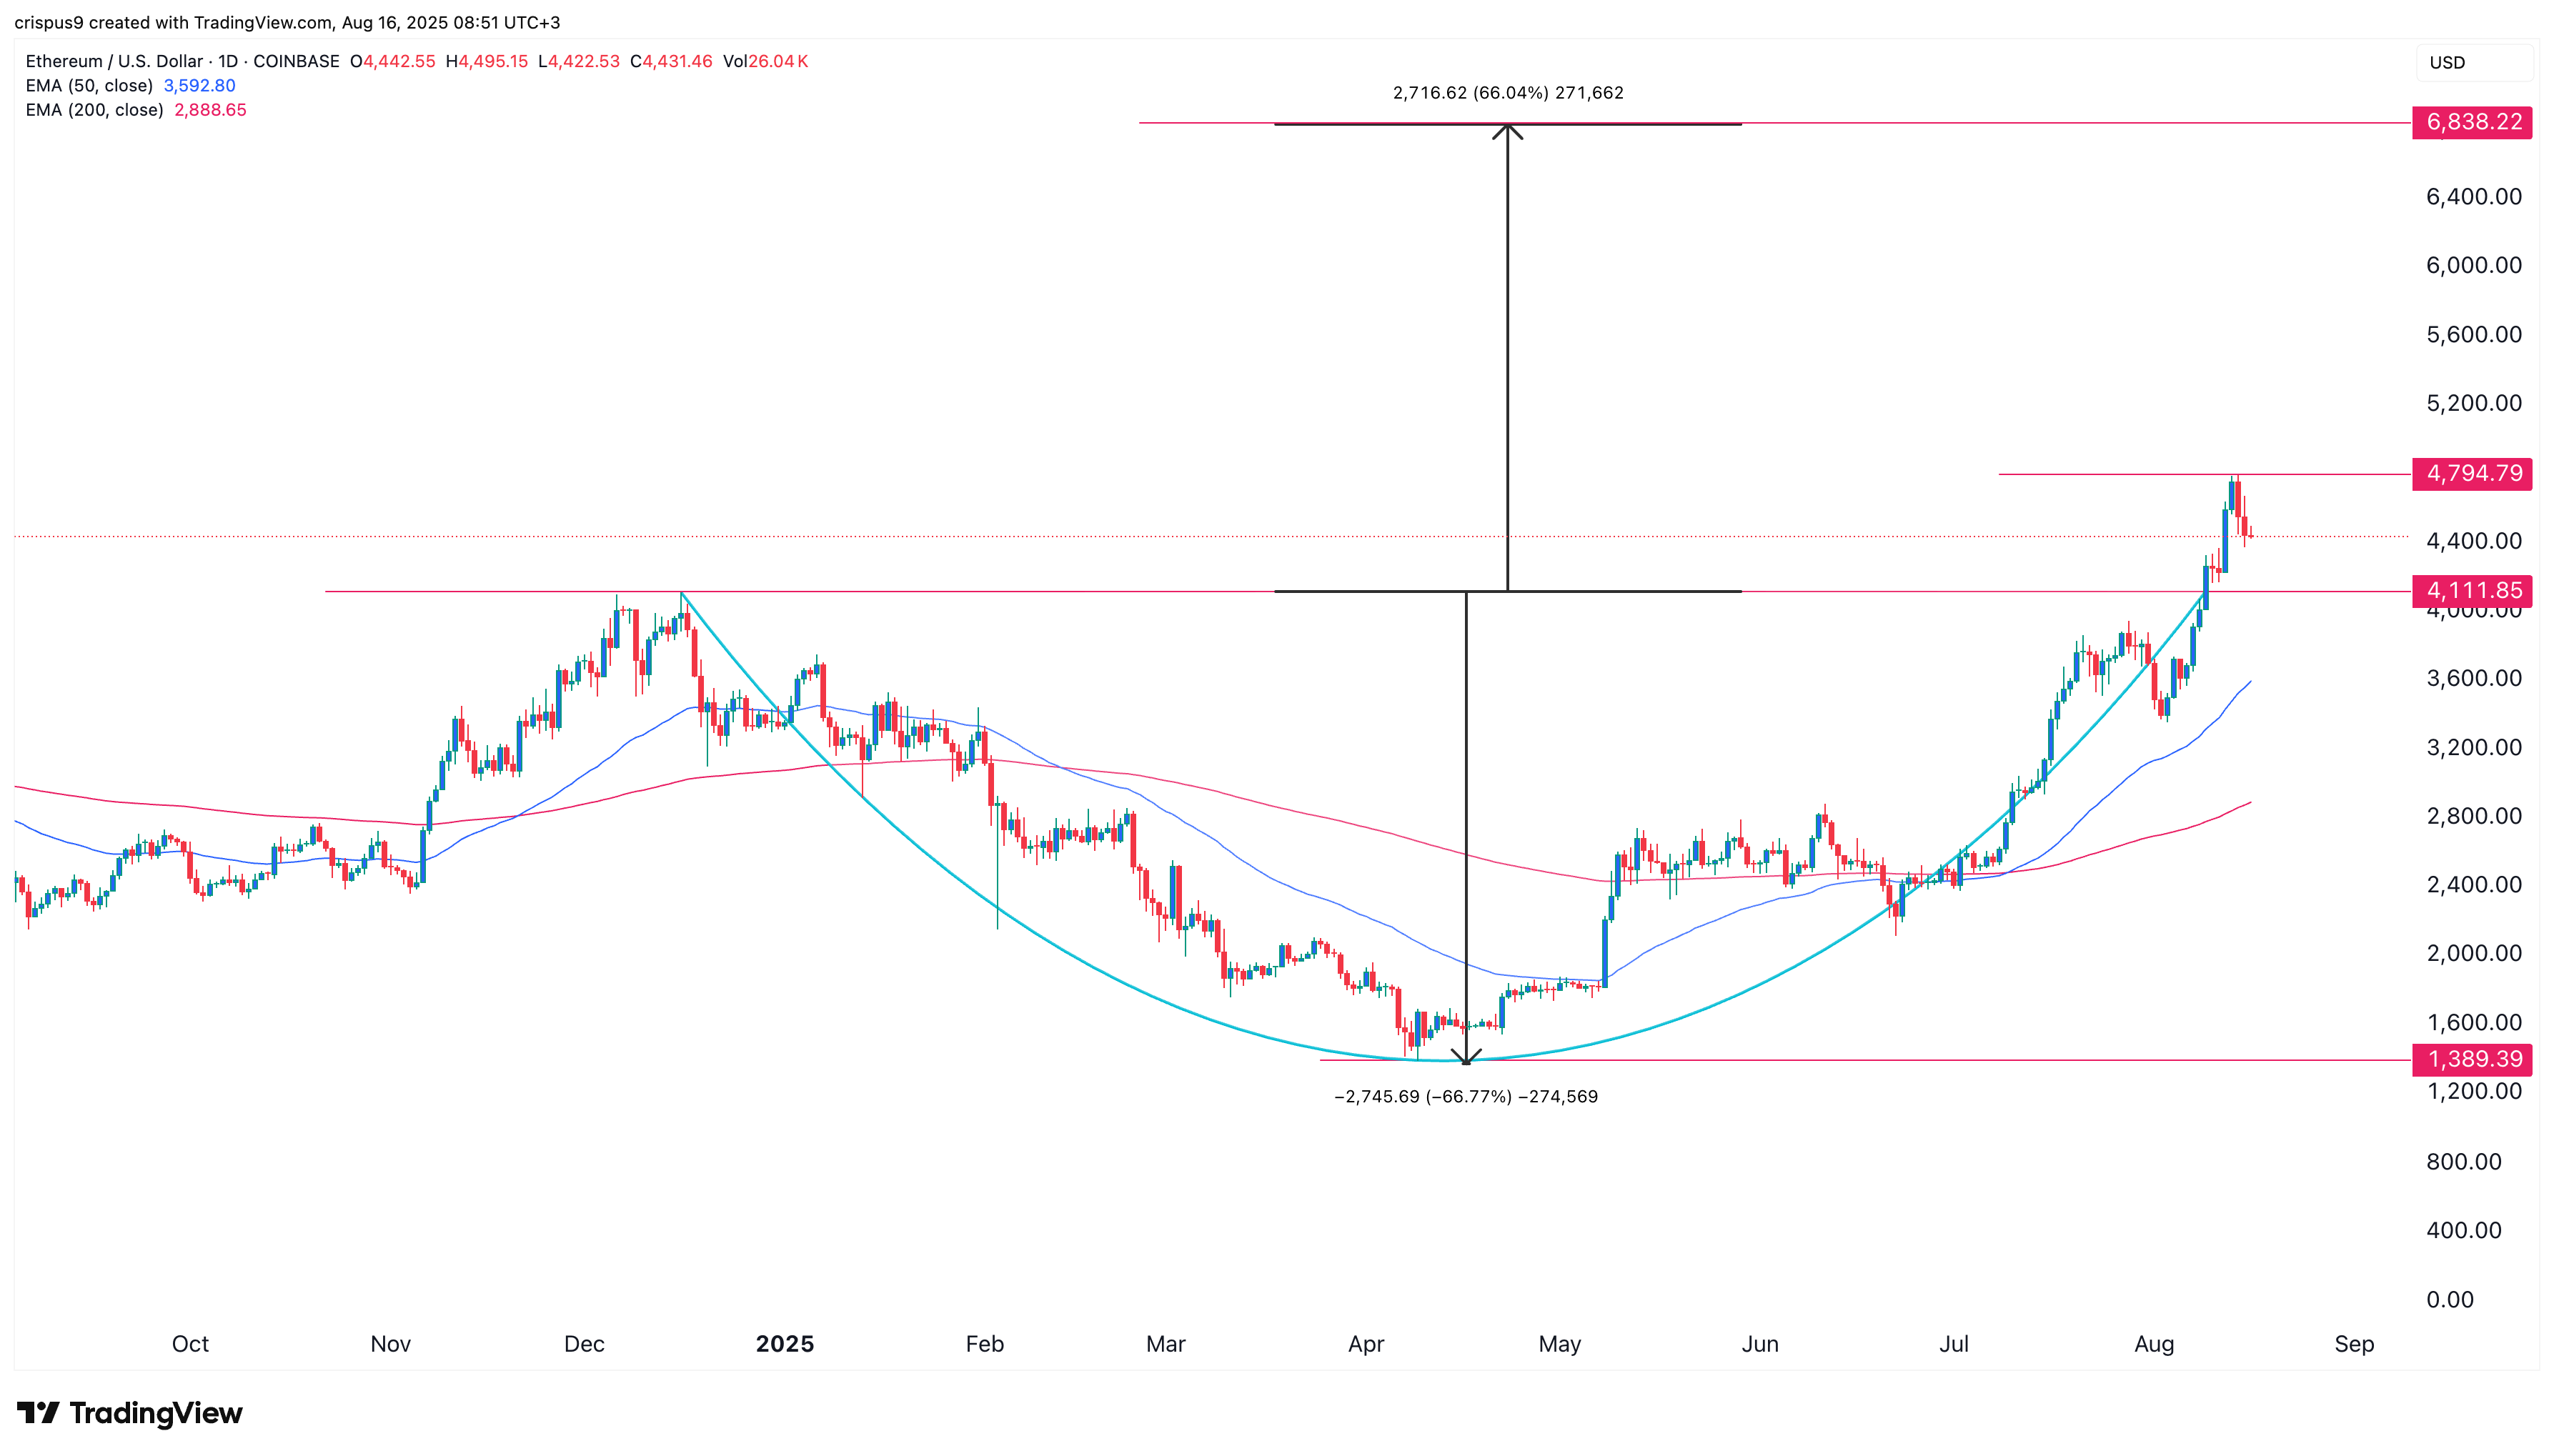
The daily timeframe chart shows that ETH price has been on a bullish momentum after bottoming in April. This surge happened as the ETF inflows and ecosystem growth gained momentum.
ETH formed a golden cross in July, confirming the bullish momentum. Most importantly, it formed a cup-and-handle pattern with a depth of 68%.
Measuring the same distance from the cup’s upper side yields a target of $6,840, which is approximately 55% above the current level.
However, in the near term, ethereum price will likely retest the support at $4,110 and then bounce back. This pattern is known as a break-and-retest. It occurs when an asset breaks out above a crucial resistance level, retests it, and then resumes its bullish trend.
