Bitcoin Defies Gravity at $119K: Leverage Drop Shields Against Sharp Corrections

Bitcoin scoffs at pullbacks—again. The king of crypto hovers near $119K, shrugging off volatility as leveraged positions unwind. Traders betting against it? Not today.
Leverage liquidation = market stability (for once)
Fewer overextended positions mean fewer cascading liquidations. A rare win for risk management in a space that still treats 'stop-loss' as a theoretical concept.
Institutional FOMO meets trader pragmatism
Whales keep stacking, retail keeps hodling, and Wall Street's latecomers now pay a 6-figure entry fee—just as the 'experts' who missed it at $20K start calling it 'overheated.' Classic.
Bottom line: Bitcoin's doing its best impression of a stablecoin—until the next 20% move. Probably up, because Wall Street still hasn't figured out how to short it without getting burned.
Bitcoin leverage drop supports market stability
The recent drop in leverage indicates that traders have been lowering their aggressive positions, even though prices are still high. This unwinding has helped to prevent the rapid, cascading sell-offs that often follow highly Leveraged rallies.
As per Arab Chain’s insights, Bitcoin’s (BTC) current price action seems to be driven by actual liquidity rather than excessive speculation, as the ELR remains stable in the 0.24–0.25 range. The market may have a better basis for future gains if leverage and spot demand are kept in balance.
Bitcoin technical analysis
On the 4-hour chart, BTC is hovering just below the midline of its Bollinger Bands, with the upper band, which is NEAR $119,900, acting as a strong resistance. While the relative strength index, at 55, does not suggest either overheated buying or deep selling pressure, the stochastic %K, at 68.7, indicates steady but not extreme momentum.
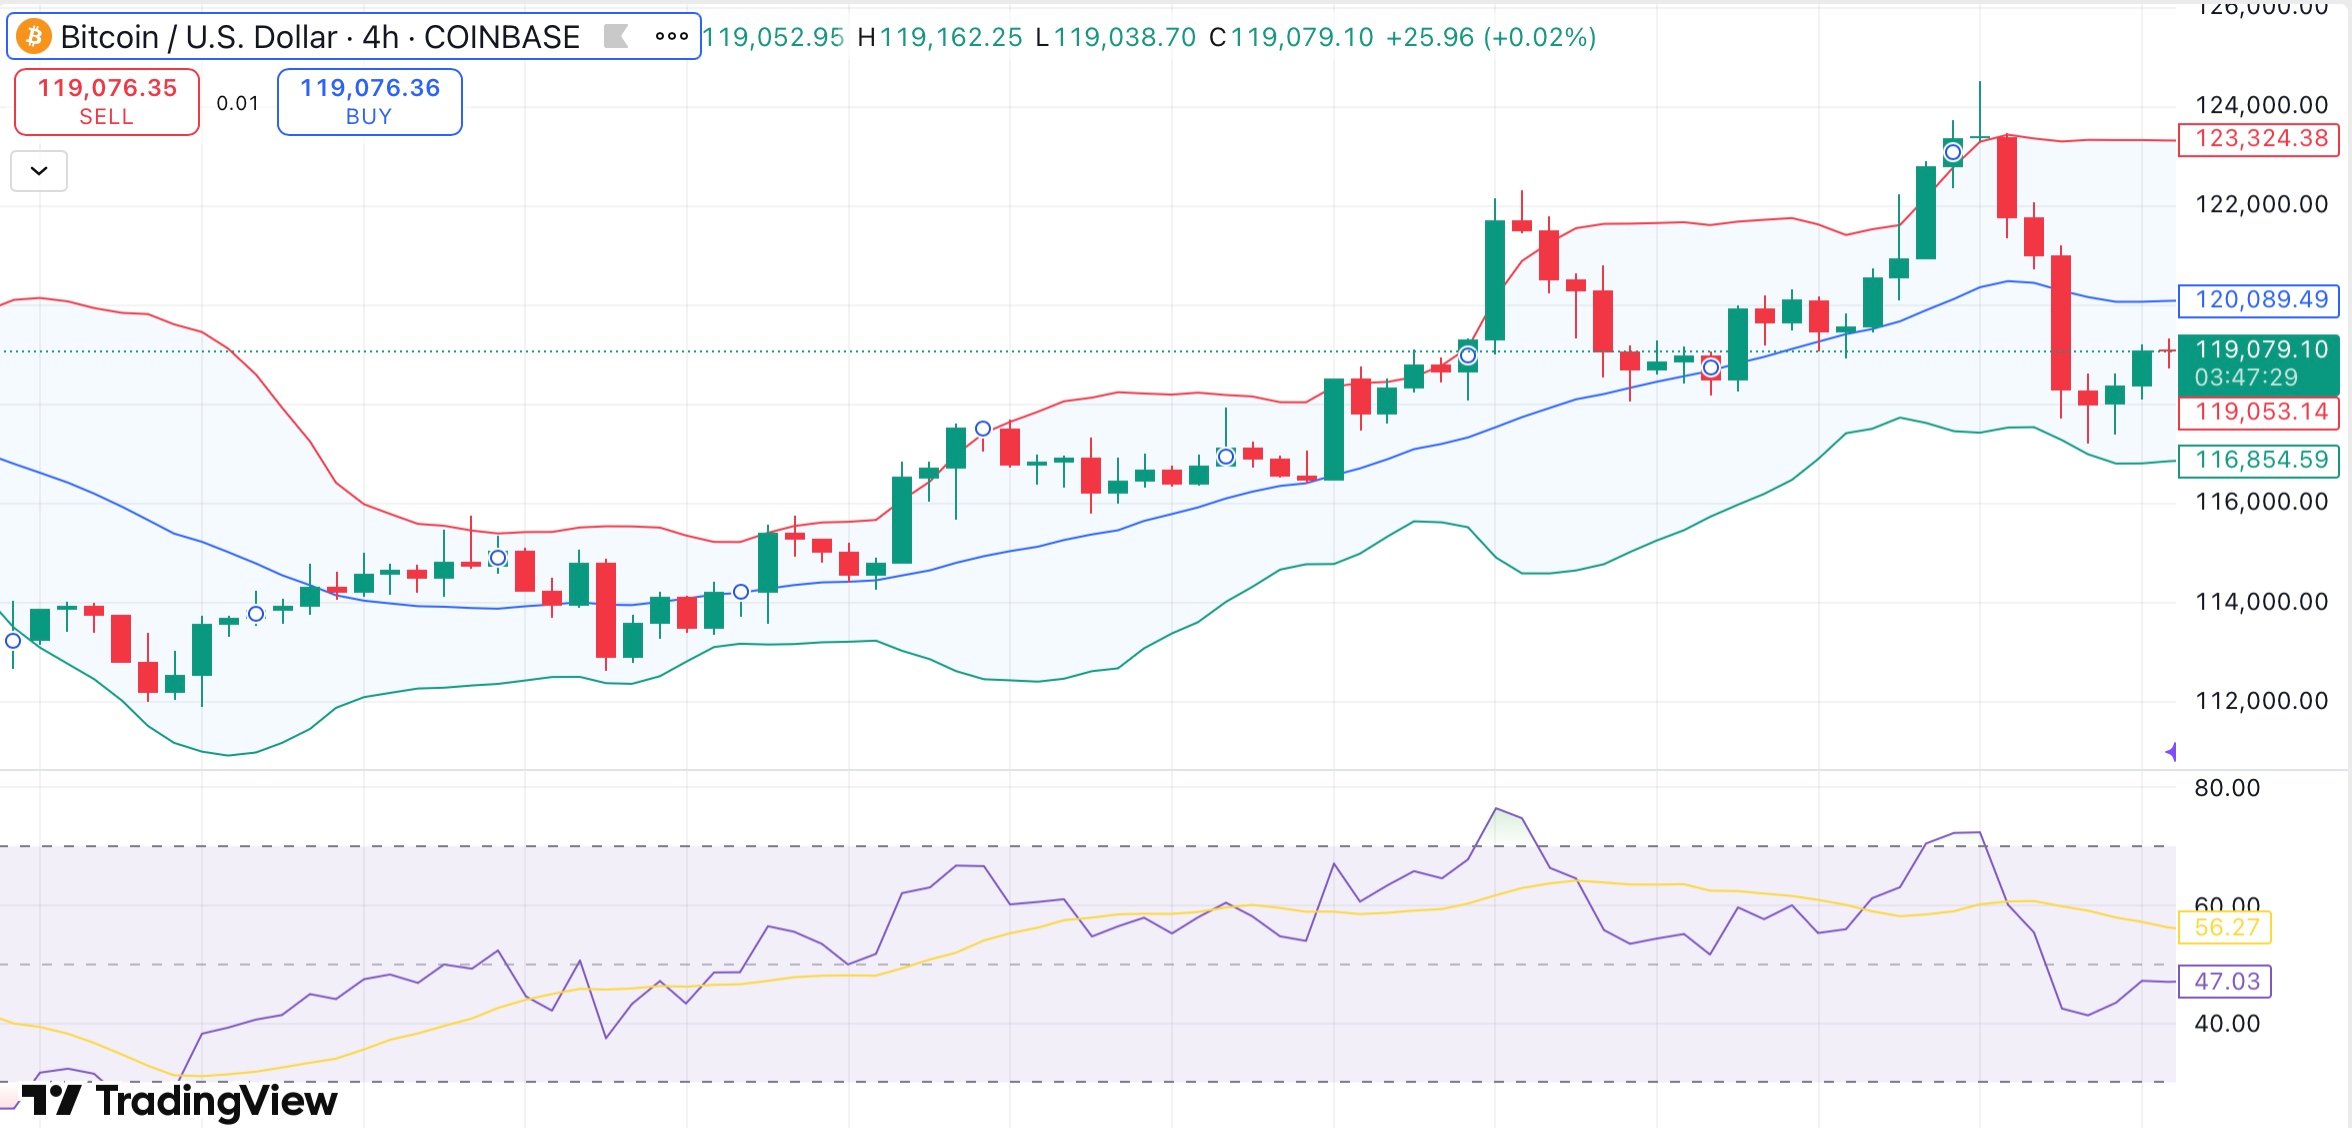
The short- to long-term moving averages, which span from the 10-day EMA at $118,676 to the 200-day SMA close at $100,152, exhibit bullish alignment. A positive Bull Bear Power reading supports the flash buy signals displayed by the momentum and MACD indicators.
If leverage remains in check, clearing $119,900 could lead to a run toward $123,000. The price may decline toward $117,700 (20-day EMA) or $114,900 (50-day EMA) if there is a rejection at $120,000 and ELR spikes above 0.27.
