Bonk’s Make-or-Break Moment: Bullish Reversal Looms as Price Tests Critical Support

Memecoin traders, brace yourselves—Bonk’s chart is flashing a high-stakes signal.
After a sharp corrective pullback, the dog-themed token is sniffing around a make-or-break support level. What happens next could define its 2025 trajectory.
The Setup: A Textbook Bullish Springboard?
Bonk’s recent dip mirrors classic crypto retracements before explosive rallies. The key difference? This time, it’s playing out under the watchful eyes of leveraged traders and institutional sharks—because nothing says 'decentralized' like hedge funds moon-bagging a Shiba Inu spinoff.
Why This Level Matters
The current zone isn’t just psychological support—it’s where open interest spikes and liquidation cascades either fuel a rebound or trigger panic. For bulls, it’s a potential golden entry; for skeptics, yet another 'buy the dip' trap in a market addicted to hopium.
The Bottom Line
Bonk’s next 48 hours could deliver either a face-melting squeeze or a humbling lesson in memecoin gravity. Either way, grab popcorn—and maybe a risk management strategy (if you’re into that sort of thing).
Key technical points
- Major Support Zone: Confluence of the point of control, 200 EMA, and 0.618 Fibonacci retracement.
- Resistance Target: Daily resistance and swing high as the primary upside objectives.
- Market Structure: Bullish bias maintained with consecutive higher highs and higher lows.
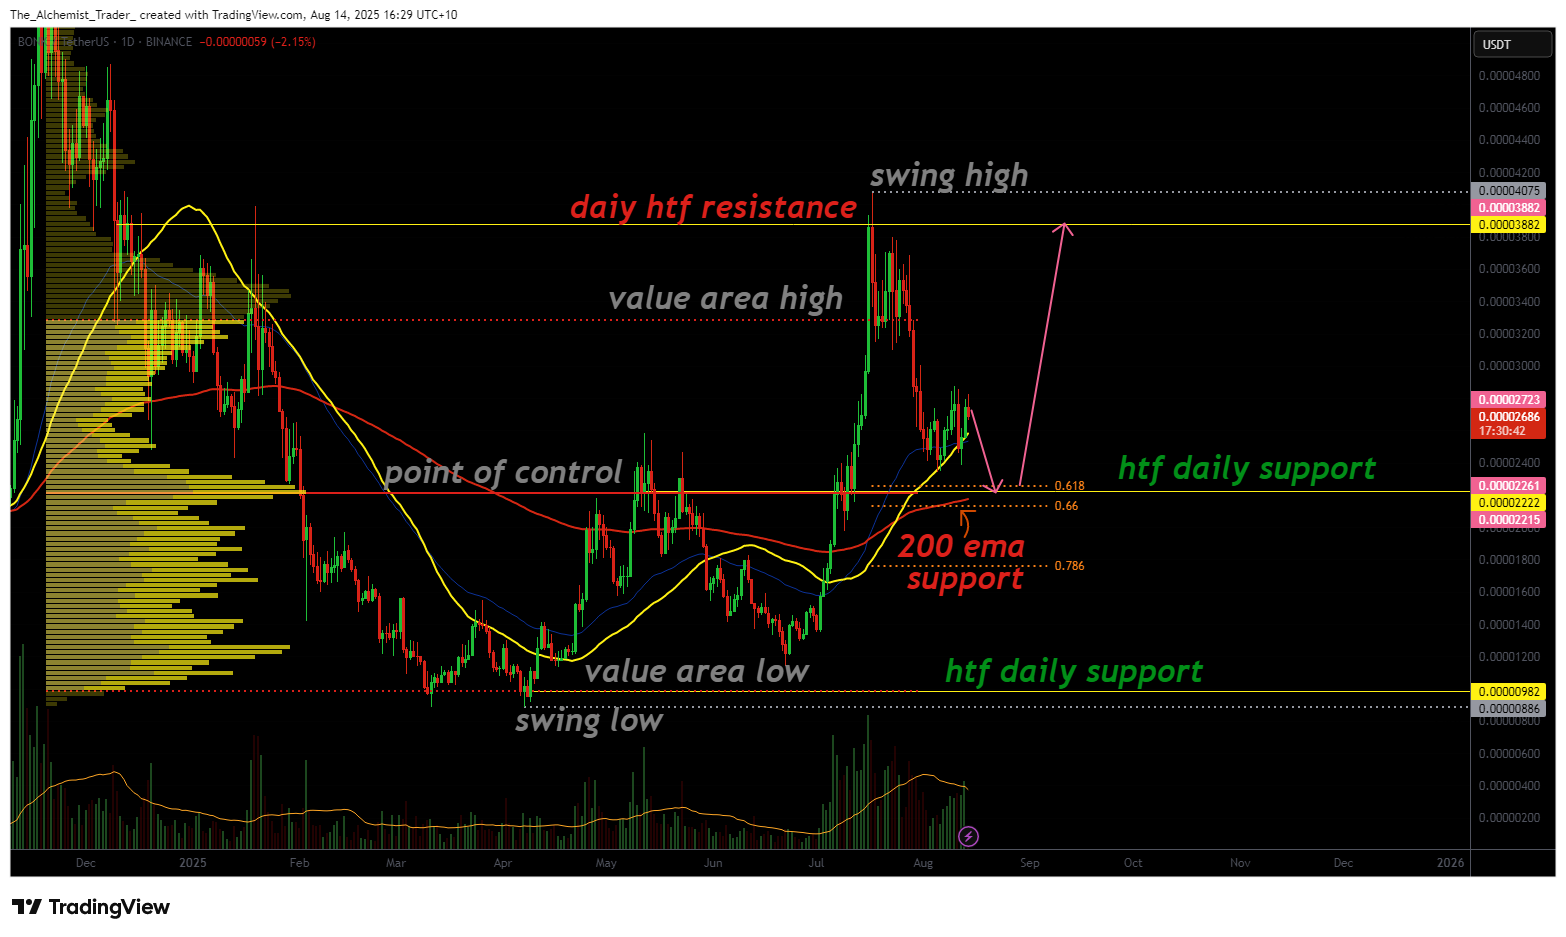
Price action has recently lost the value area high, leading to a pullback toward a strong technical confluence zone. This area, marked by the point of control, the 200 EMA, and the 0.618 Fibonacci retracement, offers significant support from a structural and volume profile perspective. Historically, such confluence zones have served as springboards for bullish reversals, particularly in assets with an intact uptrend like BONK.
From a structural standpoint, BONK continues to print higher highs and higher lows on the high-timeframe charts. This indicates that the broader bullish trend remains in place despite the current correction. The recent decline appears to be a standard pullback within the context of this trend, potentially offering an accumulation opportunity for buyers.
Volume profile analysis reinforces this outlook. The point of control represents the highest-traded volume level within the current range, often acting as a magnet for price and a level where demand re-emerges. A sustained defense of this level, even with brief wicks below, WOULD confirm that buyers are stepping in to absorb selling pressure. For this reversal to gain traction, bullish volume influxes will be critical, signaling that market participants are committed to pushing price higher.
If confirmed, a reversal from this zone could initiate a range-bound movement between the major support and daily resistance. A breakout above daily resistance would be the next bullish trigger, potentially opening the path for a sustained move toward the swing high.
What to expect in the coming price action
As long as BONK holds the confluence support zone, the probability of a bullish reversal remains high. Traders should watch for a confirmed higher low backed by rising volume. A breach of daily resistance would solidify bullish momentum and open the door for further upside toward prior highs.
