Solana Price Alert: Rare Pattern Signals Potential Surge to $240—Time to Buy?

Solana's chart just flashed a rare bullish pattern—and traders are betting it could catapult SOL to $240. Here's why the smart money's watching.
The breakout setup resembles historical rallies that delivered triple-digit gains. But with crypto, even 'sure things' love to fake out retail investors.
Key levels to watch: A clean hold above $180 could confirm the uptrend. Below $150? The pattern fails—along with overleveraged moonboys' portfolios.
Wall Street's latest 'crypto expert' will inevitably call this technical analysis. We call it gambling with better charts.
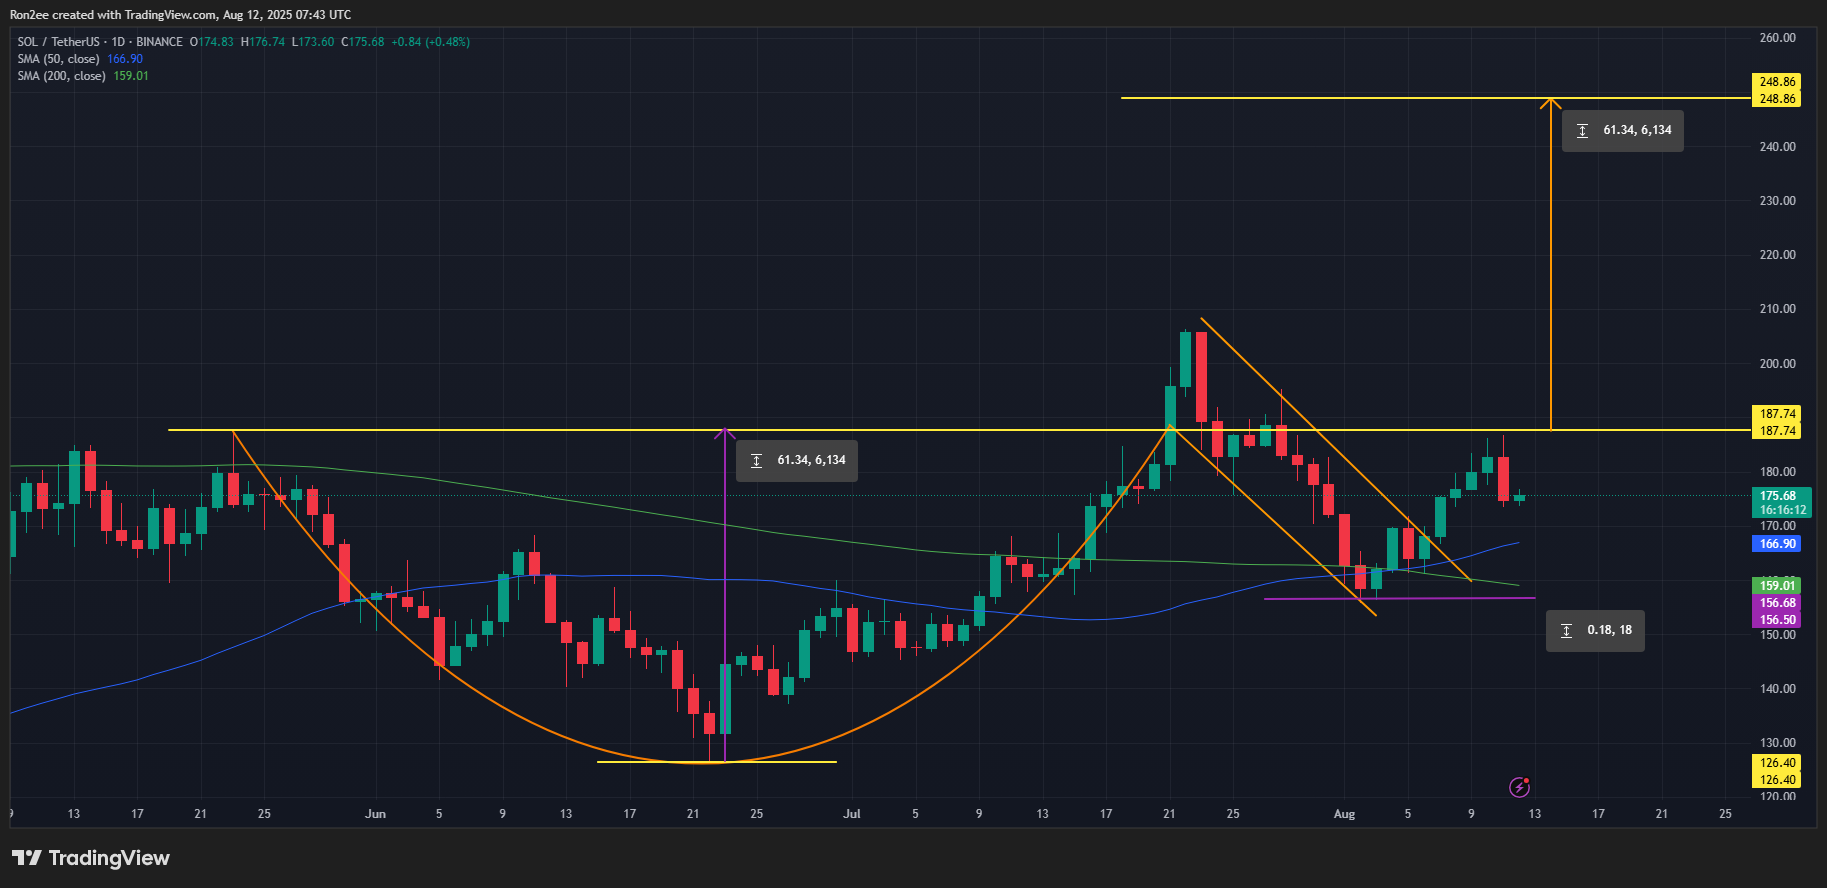
SOL forms a golden cross
SOL has formed a golden cross on the daily chart. The pattern usually forms when the 50-day simple moving average crosses above the 200-day one, and it is typically viewed as a bullish signal within the crypto trading community.
A similar pattern was spotted last year in October. At the time, SOL rallied nearly 50% in the next three months.
This time around, if the price follows the historical trend, SOL may embark on a similar rally, which could push its price as high as $240.
On top of the previous setup, SOL has also printed a cup-and-handle pattern, with its base at $126.4 and neckline resistance around $187.74.
The distance between the cup’s upper and lower bounds is roughly 48%. Projecting the same MOVE from the upper boundary, SOL eyes a potential rally toward $248, slightly exceeding the target set by the golden cross above.
When a golden cross and a cup-and-handle pattern both appear, it’s essentially two bullish technical signals aligning, which traders often interpret as a high-probability continuation setup for an uptrend.
However, this bullish outlook WOULD be invalidated if the price falls below the closest support area ,which is around $156. This level marks the lower end of the handle.
Disclosure: This article does not represent investment advice. The content and materials featured on this page are for educational purposes only.
