Bitcoin Price Primed for ATH Surge This Week – Here’s Why

Bitcoin’s gearing up for a potential breakout—and the charts are flashing bullish signals. Traders are betting big as key resistance levels crack under pressure.
Market sentiment’s shifted from ‘wait-and-see’ to ‘FOMO at the highs’—thanks to a perfect storm of institutional inflows and retail traders piling in late (as usual). Technical indicators suggest the rally’s got legs, with the $70K threshold looking like a speed bump rather than a ceiling.
Meanwhile, Wall Street’s still trying to explain the move to clients—probably while quietly rebalancing into BTC futures. The irony? Traditional finance spent years dismissing crypto, only to chase the pump like everyone else.
If volume holds, we could see new all-time highs by Friday. And if not? Well, there’s always next week’s narrative.
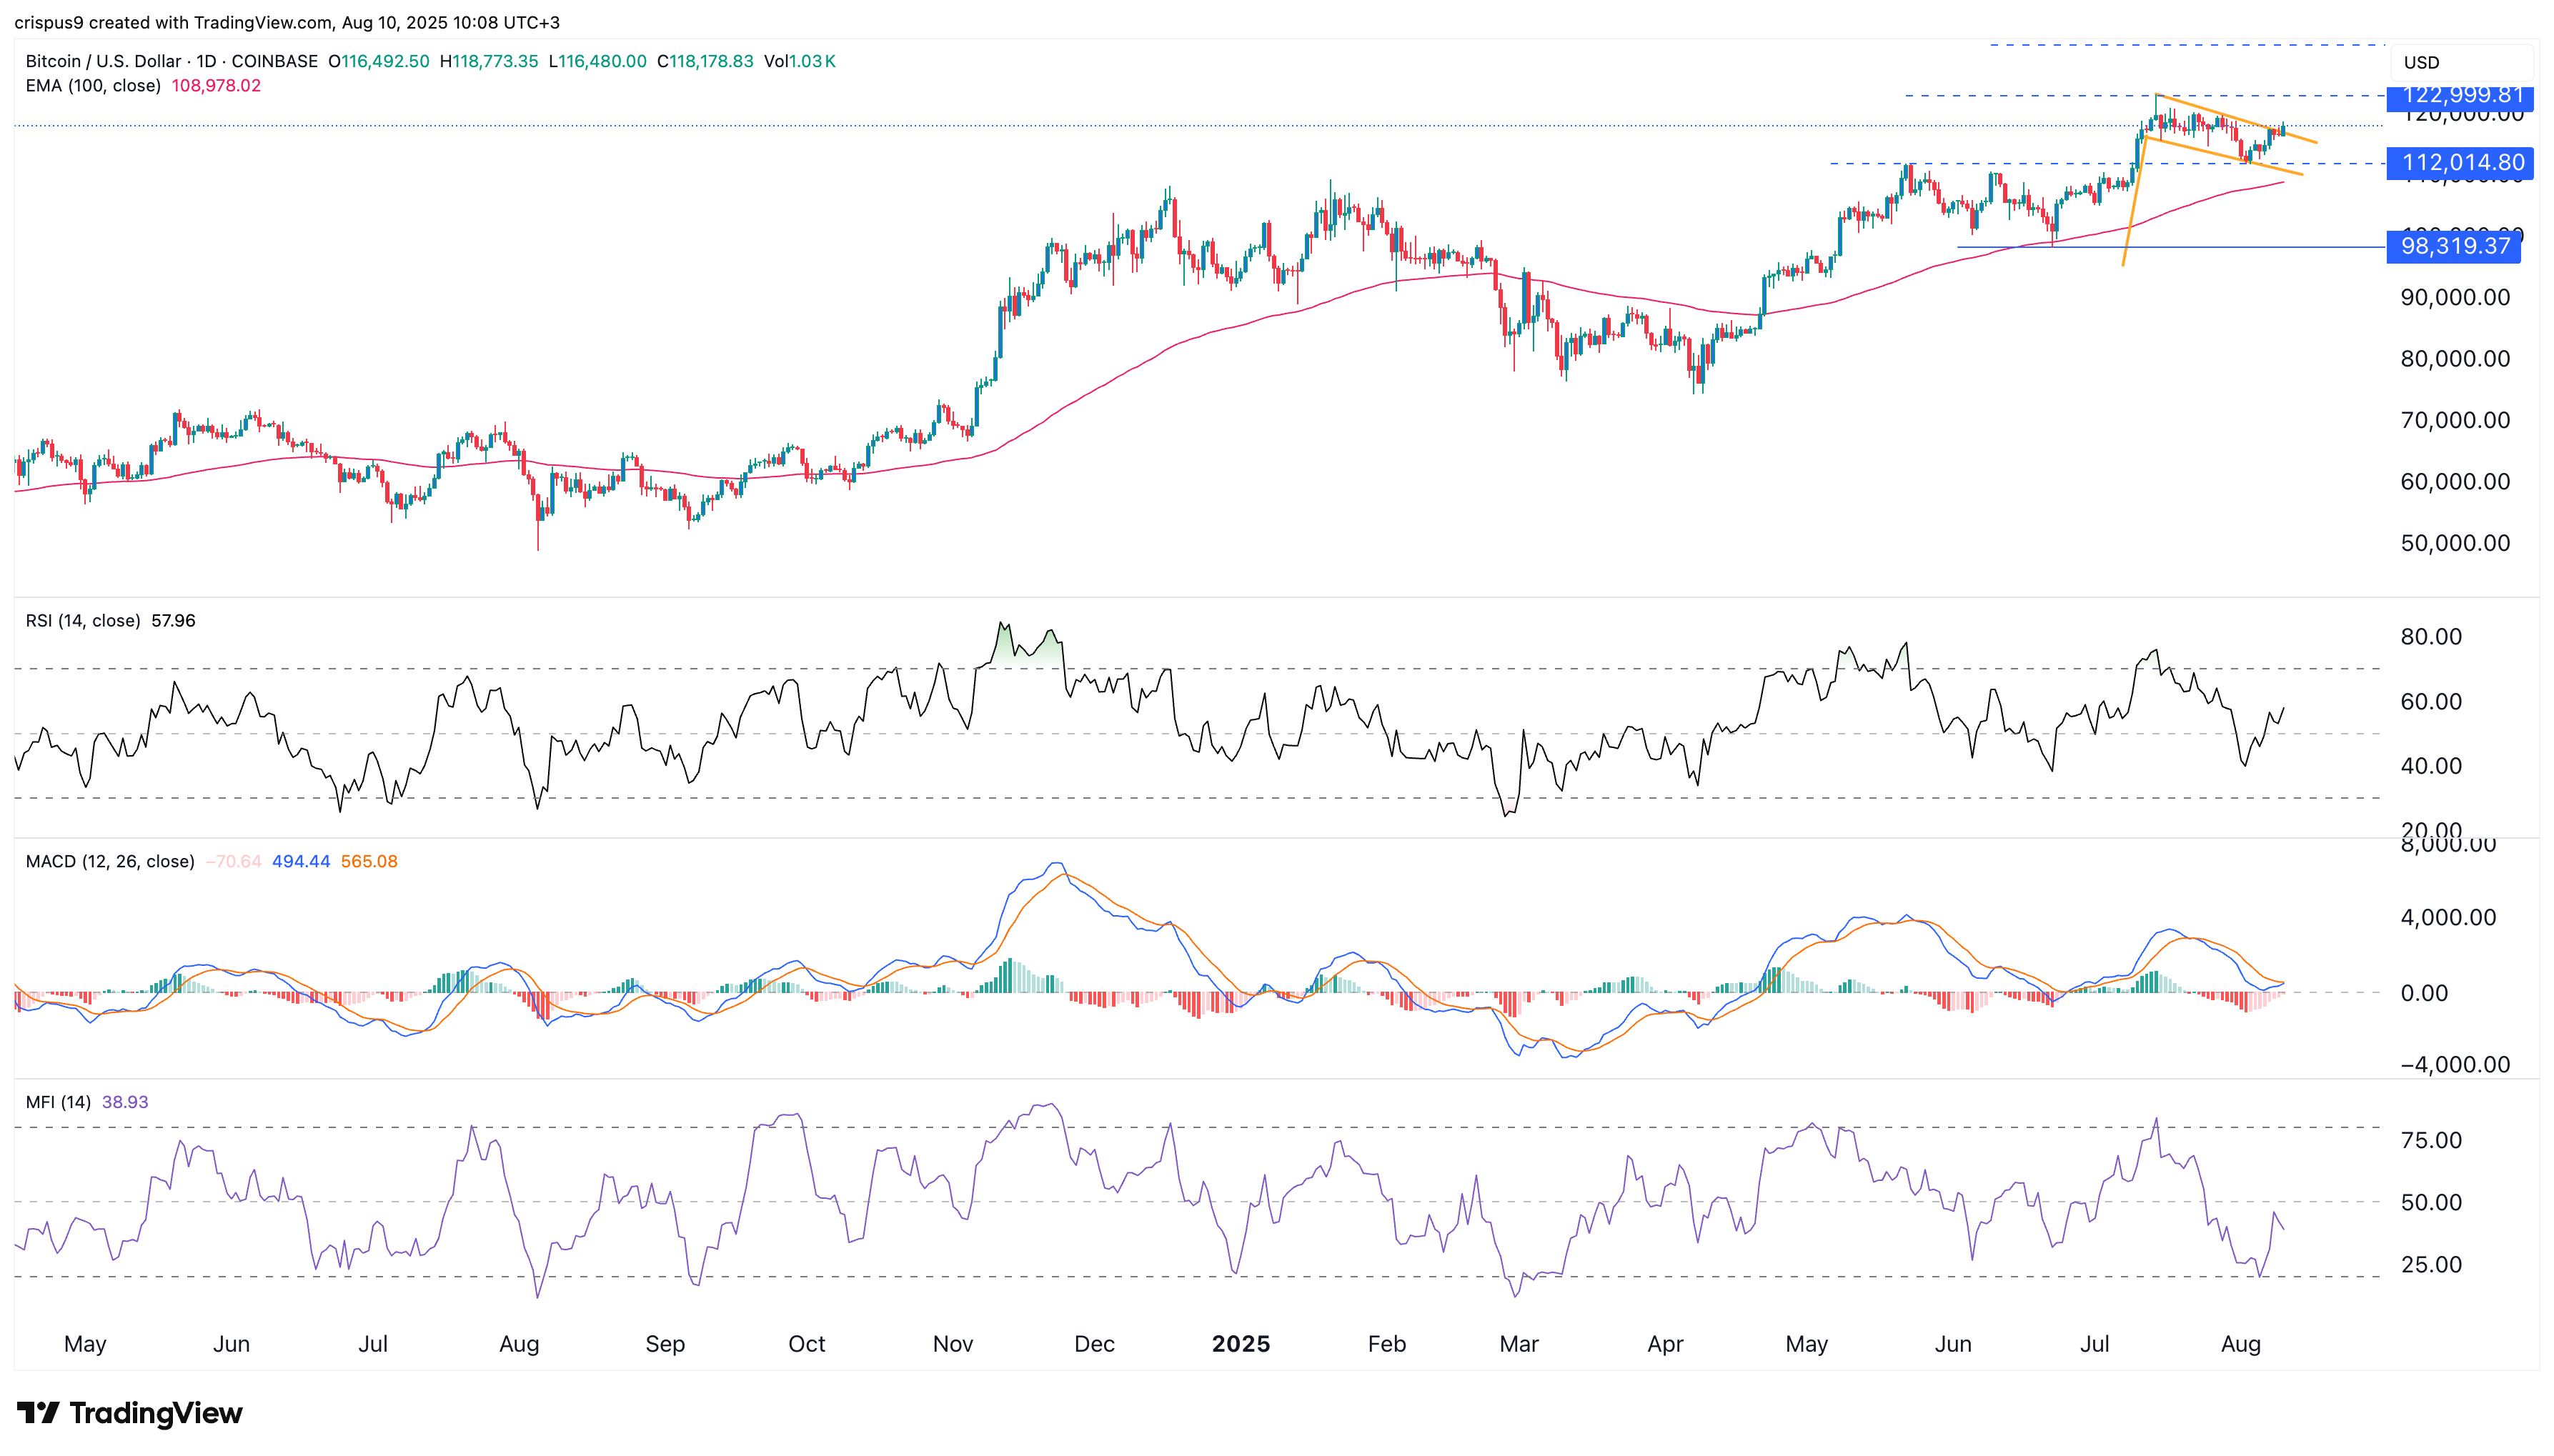
Bitcoin price to hit ATH as bullish flag activates
The daily chart shows that the BTC price has been forming a bullish flag pattern, which often precedes a strong breakout. This pattern started its formation on June 22 when it bottomed at $98,320 and peaked at the all-time high of $123,200, giving it a height of nearly $25,000.
It has been forming the flag section, which is characterized by a falling channel. Now, there are signs that it is breaking out above the upper side of the flag.
The price target in a bullish flag pattern is estimated by adding the flag’s height to the breakout point, which, in this case, is at $117,000. Adding the two gives the price target of $142,000.
The other catalyst for Bitcoin price is that it remains above the 100-day Exponential Moving Average. It has also formed a break-and-retest pattern by falling to the support at $112,000, which was its previous all-time high.
Top indicators also point to more gains in the NEAR term. The Relative Strength Index has jumped and crossed the neutral point at 50. Other oscillators, such as the MACD and the MFI, have also pointed upward.
Federal Reserve cut hopes and ETF inflows
Bitcoin price has potential catalysts that may fuel its surge to a record high this week. For example, data shows that American investors have continued to accumulate it. ETF inflows jumped by over $246 million last week, a big reversal from the previous week’s net outflows of $643 million.
The soaring bitcoin demand, including from treasury companies, occurred as supply on exchanges has plunged to the lowest level in years, which is bullish.
Meanwhile, the odds of the Federal Reserve starting to cut interest rates in the September meeting have jumped. These odds soared after the US released weak nonfarm payrolls dataearlier this month.
The probability will likely rise if the U.S. publishes weaker-than-expected consumer price index data on Tuesday. Economists expect the data to show that the headline CPI ROSE to 2.8% in July as the impact of tariffs started to show.
