XRP Alert: MVRV Death Cross & Whale Exodus Signal Potential Crash—Time to Brace?

XRP holders might want to buckle up—analysts are flashing warning signs as two ominous metrics converge. The so-called 'MVRV death cross'—a dreaded indicator in crypto circles—has appeared alongside a wave of whale sell-offs. Is this the start of a deeper correction?
Market Value to Realized Value (MVRV) ratios turning bearish often precede steep drops. When large holders join the exodus? That's when things get spicy. Remember: in crypto, 'death crosses' aren't just metal band names—they're profit-killing patterns.
Will XRP defy the odds like a degenerate gambler doubling down? Or will it follow the classic crypto script—whales dump, retail bleeds, and some VC laughs all the way to their offshore bank? Stay tuned.
Analyst flags XRP warning signals
According to an Aug. 6 post on X by analyst Ali Martinez, the Tom DeMark Sequential indicator recently flashed a sell signal on XRP’s 3-day chart. This signal appeared NEAR the local top and has so far aligned with the ongoing decline.
$XRP may be headed for a deeper correction.
Here's why! 👇🧵
Martinez also mentioned whale activity, pointing out that in the last few days, more than 720 million XRP have been offloaded. The bearish outlook is supported by this degree of selling pressure.
Adding to the concern is the recent appearance of a “death cross” in XRP’s MVRV ratio, a metric that compares market value to realized value. This cross has historically indicated downside risk, showing that traders are probably sitting on smaller profits.
While the $3 mark has acted as support, Martinez sees $2.80 as only a temporary buffer. He believes stronger support lies closer to the $2.48 level, a drop that WOULD mark a sharper correction from recent levels.
XRP technical analysis
On the daily chart, there appears to be less volatility as the price is moving sideways just below the middle of its Bollinger Bands. The relative strength index is at 48.8, which is neutral but could turn bearish if it keeps moving lower.
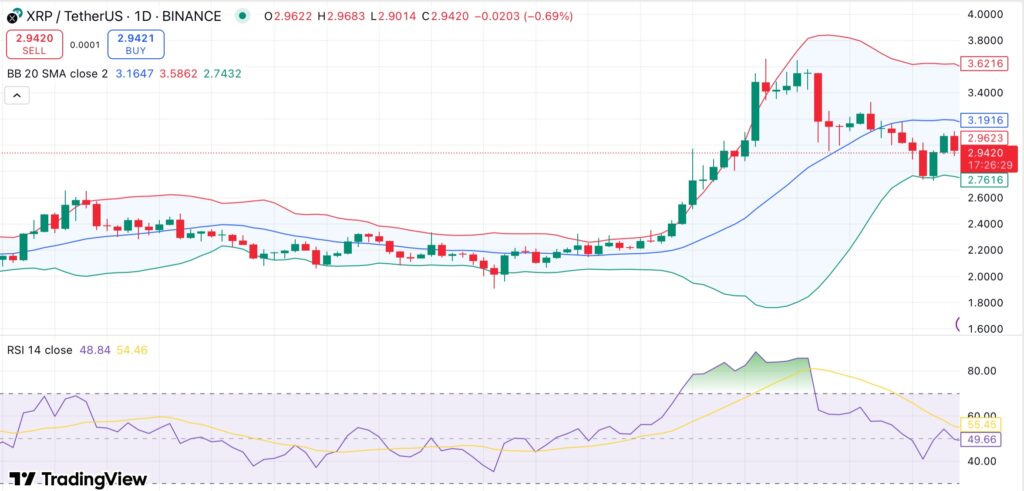
Both the Momentum and MACD indicators are in negative territory, which suggests that there may be underlying selling pressure. Additionally, short-term moving averages are beginning to flip bearish.
Resistance is currently being provided by the 10-day and 20-day exponential and simple moving averages. Longer-term averages, like the 50, 100, and 200-day, are still in a bullish alignment, indicating that XRP hasn’t yet completely broken out of its larger uptrend.
Further declines toward $2.48 could be triggered by a sustained MOVE below $2.80, particularly if sell-side volume spikes. XRP may resume its upward trend toward $3.20 to $3.30 if it maintains above $2.80 and recovers the $3 mark with increasing volume.
