Fartcoin Revival? Why This Memecoin Could Explode After Its Recent Correction

Fartcoin—the joke token that refused to die—is flashing bullish signals again. After a brutal 60% drawdown from its 2025 peak, the memecoin’s chart hints at a potential breakout. Here’s why traders are paying attention.
### The Lazarus Effect: From Meme to Market Mover
Once dismissed as a parody, Fartcoin’s 2024 rally proved even ‘useless’ tokens can catch fire. Now, its network activity shows unusual spikes—suggesting whales might be accumulating.
### Technicals Scream ‘Oversold’
RSI at 28. Three consecutive bullish divergences on the 4-hour chart. The last time these aligned? A 400% pump followed. Of course, past performance guarantees nothing—especially when trading something named after bodily functions.
### The Cynic’s Take
Let’s be real: this is gambling dressed as analysis. But in a market where Dogecoin hit $70B and a literal ‘Useless Token’ mooned, why shouldn’t Fartcoin get another day in the sun? Just maybe keep a stop-loss handy—unless you enjoy financial flatulence.
 Source: TradingView
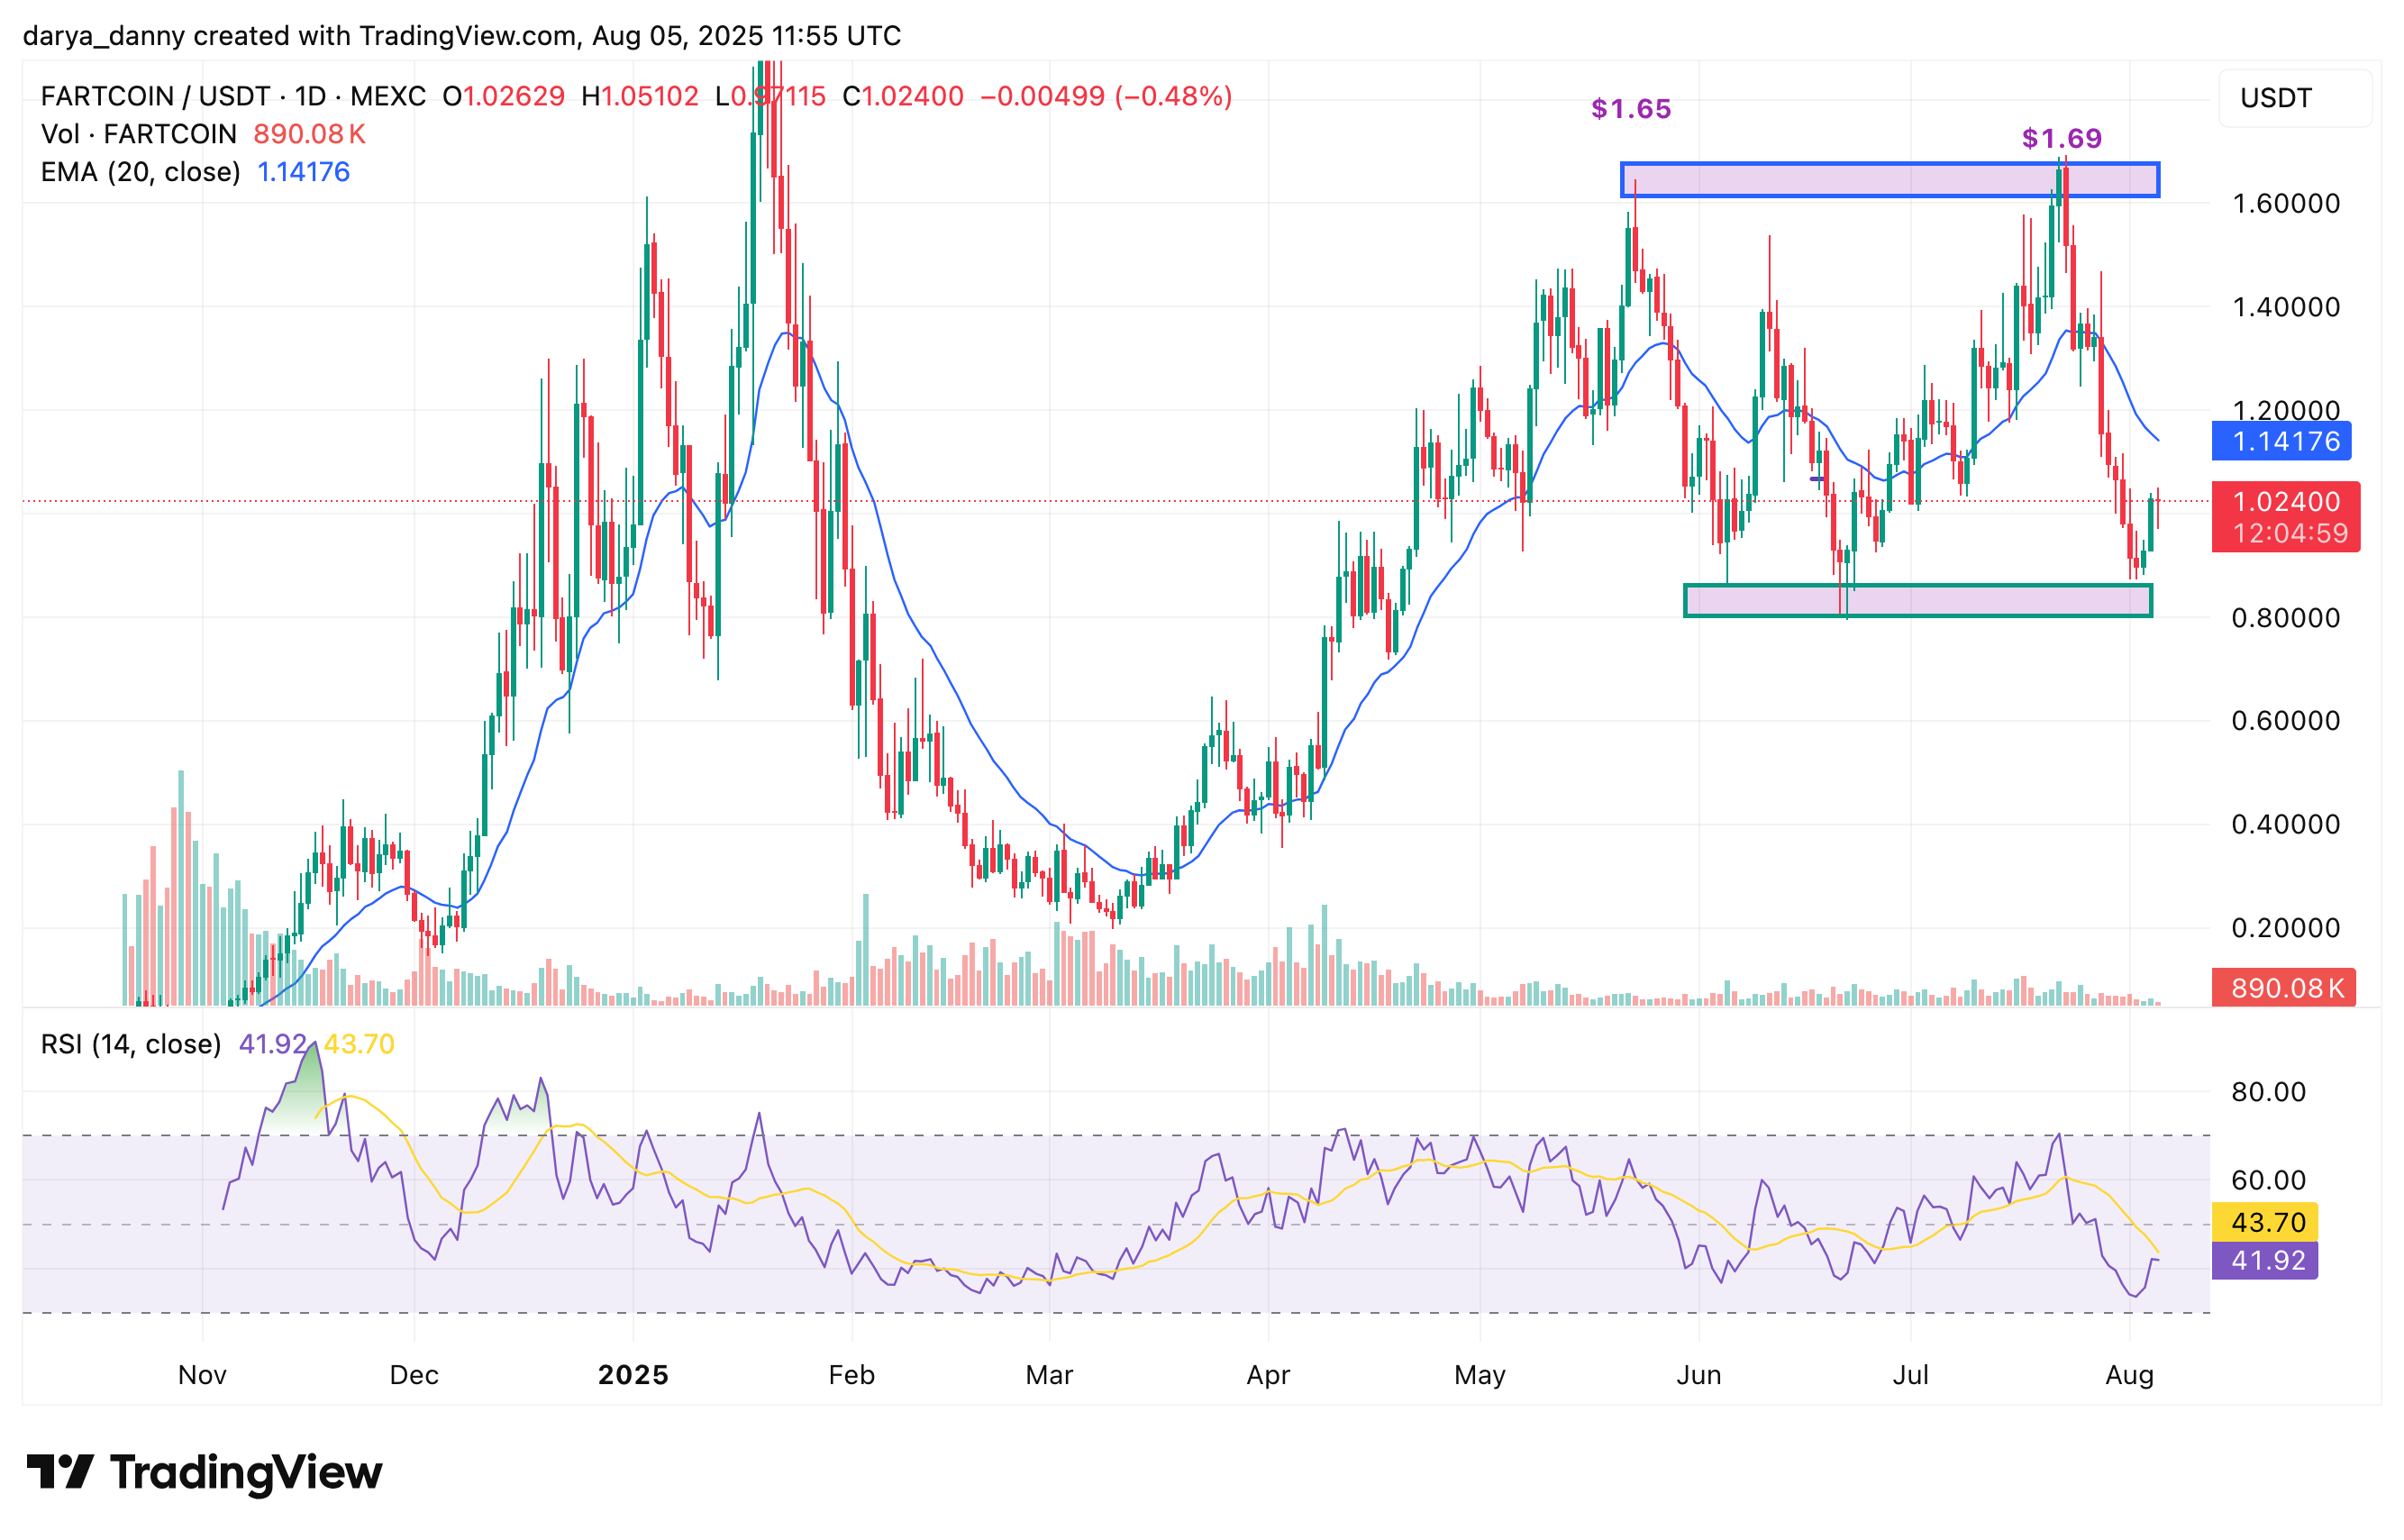
The consolidation appears to be taking a broad horizontal range shape, with well-defined support NEAR $0.81–$0.87 and overhead resistance clustered between $1.54 and $1.69. Multiple retests of the lower boundary suggest strong buyer defense, forming what could evolve into a triple bottom reversal structure if the upper resistance is eventually breached.
Fartcoin price prediction
As far as the technicals are concerned, the RSI has rebounded from near-oversold territory reached during the recent dip to $0.87 just a couple of days ago, leaving ample room for a climb toward the $1.54–$1.69 resistance band.
Importantly, the latest swing high ($1.69) also came in slightly above the previous rally peak ($1.65), a subtle sign of strengthening bullish momentum. This higher high could indicate that buyers are gradually regaining control and building the pressure needed for an eventual breakout above the neckline.
A confirmed breakout above $1.69 could pave the way for a measured MOVE toward the $2.40–$2.50 zone — representing roughly a 135%–145% gain from the current price of $1.02.
On the flip side, failure to hold above the $0.81–$0.87 support band could shift the bias back to bearish, with the next downside checkpoints at $0.70 and $0.65.
