MemeCore Rockets 24.14% as Elliott Wave Pattern Signals $0.77 Target – Meme Season Is Back

MemeCore just pulled a classic crypto breakout—soaring 24.14% in a single move as traders pile into its bullish Elliott wave setup. The meme coin’s chart now paints a clear path toward $0.77, leaving skeptics scrambling to explain why ‘useless internet money’ keeps printing gains.
Wave Theory in Action
The rally confirms a textbook five-wave impulse pattern, with the current uptrend likely just the third wave—historically the strongest. If Fibonacci extensions hold, MemeCore could triple its current price before the cycle exhausts.
Meme Market Revival
This surge coincides with renewed appetite for risk assets, proving once again that crypto traders would rather YOLO into dog-themed tokens than touch a 5% Treasury yield. Liquidity’s flooding back into altcoins, and MemeCore’s leading the pack.
Watch the $0.50 level for confirmation—a clean break likely triggers FOMO buys from institutional ‘degens’ who swore they’d never touch memes again. Just don’t mention the 99% crash that’ll inevitably follow.
Key technical points
- High Time Frame Support: Confirmed at $0.32 with multiple successful retests.
- Current Resistance: $0.62 (value area high and Fibonacci pivot).
- Next Bullish Target: $0.77 based on Fibonacci extension if structure holds.
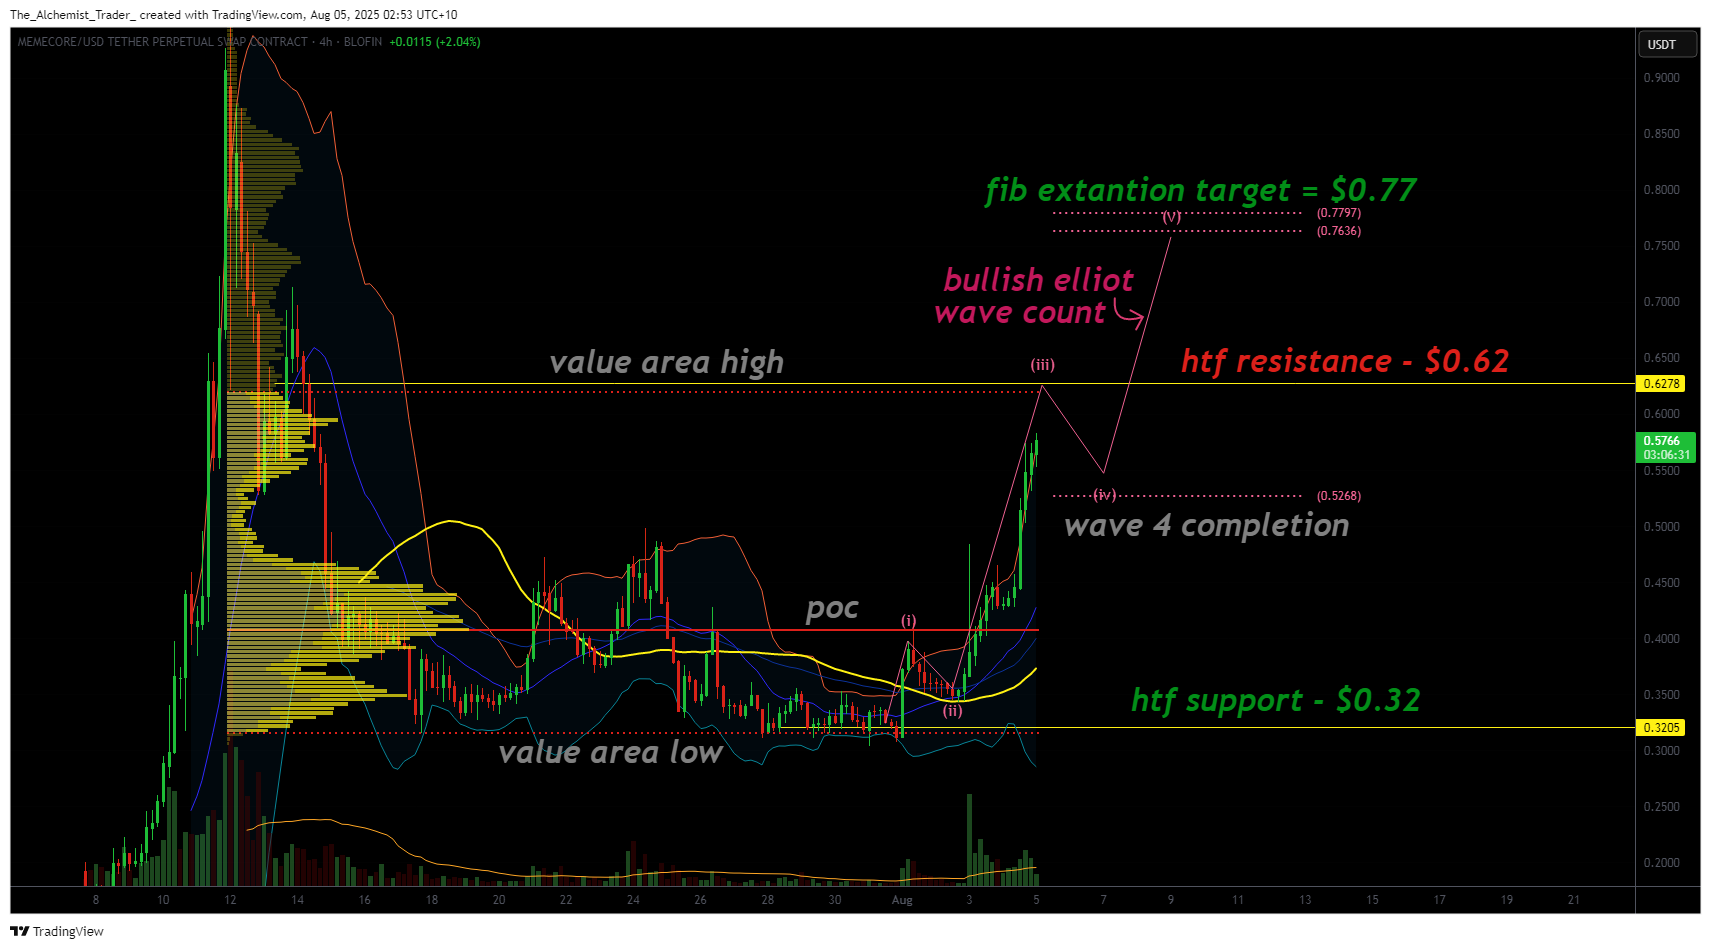
After several successful tests of high time frame support at $0.32, MemeCore established a strong base. This support coincides with the value area low, where repeated bounces signaled consistent buyer presence. Once the point of control was reclaimed, a strong impulsive move was triggered.
This rally drove price directly into the $0.62 resistance zone, which is in technical confluence with the value area high and a key Fibonacci level. MemeCore is now testing this region. Whether it holds or breaks will determine the immediate short-term path.
The structure appears to follow a textbook Elliott Wave pattern. MemeCore is likely in the third wave of a five-wave bullish sequence. Wave 3 is often the most explosive, which aligns with the strong 24% move. However, a rejection at current levels may lead to a short-term corrective phase.
If a Wave 4 correction begins, support could be found around $0.52. This zone aligns with a 1:1 corrective move relative to Wave 2. If price holds this support, the next move higher WOULD likely be Wave 5, completing the structure into the Fibonacci extension zone near $0.77.
This extension is based on trend-based projections from the early impulse, and represents a high-probability zone if structure remains intact. Volume trends support the current move, indicating the rally is driven by strong market participation.
If MemeCore breaks cleanly above $0.62, it would invalidate the corrective scenario and signal a continuation of Wave 3 toward the $0.77 region. Either scenario remains technically bullish provided $0.52 holds as support in the case of a pullback.
What to expect in the coming price action
A clean breakout above $0.62 would open the door to $0.77. If rejected, a short correction to $0.52 is expected before the next leg. Market structure remains bullish as price action resembles an Elliott Wave Impulse.

Log in to Reply
Log in to comment your thoughtsComments
Related Articles
|Square
Get the BTCC app to start your crypto journey
Get started today Scan to join our 100M+ users