Keeta Price Soars 13% Today—Here’s the Bullish Catalyst You Missed

Keeta's token defies the bears with a double-digit rebound—proof that crypto markets still love a good comeback story.
What sparked the rally? Whale accumulation, a short squeeze, or just another Tuesday in volatility land? We break down the move without the fluff.
Meanwhile, traditional finance bros are still waiting for their bonds to yield this much excitement. Spoiler: they won’t.
Why did Keeta surge today?
Keeta’s rally appears closely tied to its involvement in a major charitable initiative. On Aug. 1, the Keeta team announced a substantial donation to TeamWater, a clean water campaign led by multiple content creators, including YouTube star MrBeast, who commands a global audience of hundreds of millions.
According to MrBeast’s post on X, the initiative aims to raise $40 million to deliver decades of clean drinking water to over 2 million people.
In response to the campaign, Keeta posted on MrBeast’s official thread:
“We donated 25,000 years of clean water on behalf of the Keeta community!”
We donated 25,000 years of clean water on the behalf of the Keeta community!$KTA pic.twitter.com/y1AMGrLKRH
— Keeta (@KeetaNetwork) August 1, 2025The donation, which was prominently featured in a post viewed over 52,700 times, received 489 likes and dozens of reposts, giving the project significant social exposure. The visibility generated by this association likely contributed to the token’s sharp intraday gains, as retail investors and social sentiment began to rally behind the project.
Another catalyst for Keeta’s uptrend could be growing anticipation surrounding its scheduled listing on Kraken, one of the world’s largest cryptocurrency exchanges. According to an official July 30 announcement, the exchange is set to list Keeta (KTA) on Aug. 5 at 14:00 UTC, with trading expected to begin shortly after deposits open.
This upcoming listing has likely amplified investor interest, as exchange listings historically provide increased liquidity, credibility, and price discovery for the related asset.
From controversy to comeback
Today’s rally helped ease some of the losses Keeta sustained after blockchain analysts accused the project of faking its testnet performance. KTA crashed over 99% in June to a monthly low of $0.41.
At the time, on-chain analyst ZachXBT accused the team of running a fake testnet, claiming the explorer and transaction data were fabricated. The allegations triggered a sharp sell-off, with KTA plunging from around $1.68 to a low of $0.50.
In response, the Keeta team conducted a public stress test in collaboration with engineers from Google Spanner, reportedly demonstrating over 10 million transactions per second. They also released an updated roadmap that included SDK development, compliance tools, and mainnet goals, moves that helped calm investor concerns and restore market confidence.
KTA price action
Since early July, KTA has been trading within a rising broadening wedge, a chart pattern where both higher highs and higher lows extend outward within diverging upward trendlines.
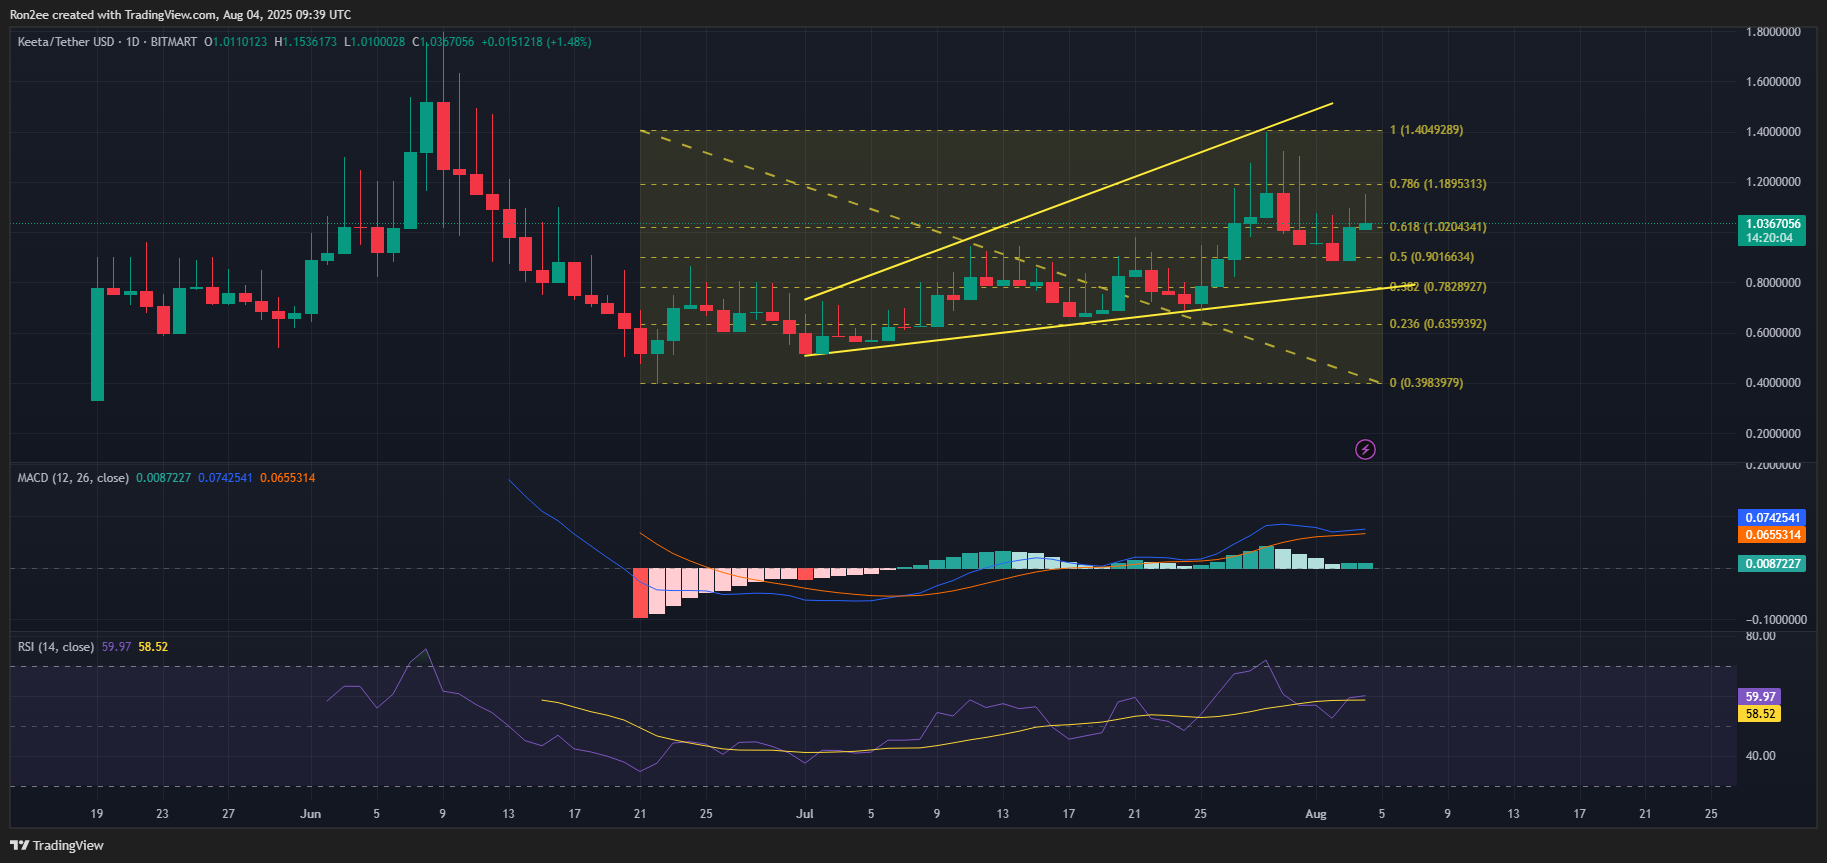
While this structure may appear bullish on the surface, it often reflects growing market instability and diminishing buyer control, and is typically viewed as a bearish reversal pattern if the price breaks below the lower trendline.
On the daily chart, the MACD lines are hovering just above the signal line, signaling waning bullish momentum but not yet confirming a trend shift. A bearish crossover could act as an early warning of downward pressure building.
Meanwhile, the Relative Strength Index has rebounded from the neutral 50 zone and now hovers near 60, indicating moderate buying strength without suggesting overbought conditions. This positioning leaves room for further upside, but also exposes the asset to vulnerability if sentiment weakens.
Technically, a breakdown below the $0.78 support level WOULD confirm the pattern’s bearish outlook and could open the door to a deeper correction toward $0.39, especially if broader market weakness persists.
Conversely, a breakout above $1.40 would invalidate the bearish implications of the pattern and may inspire renewed bullish momentum, and potentially lead to a retest of the June 9 high at $1.68, up roughly 58% from the current level.
Disclosure: This article does not represent investment advice. The content and materials featured on this page are for educational purposes only.
