XRP Plunges Into Bear Territory—But This Bullish Pattern Hints at a Ripple Revival

XRP's price action just flashed its first bear market signal in months—but don’t dump your bags yet. A hidden technical setup suggests the embattled crypto could be gearing up for a violent rebound.
Here’s why traders are quietly stacking XRP while retail panics.
The chart whispers what the headlines scream: XRP got crushed. After months of sideways action, the token finally broke down—classic bear market behavior. But zoom out, and you’ll spot the real story.
Hidden bullish divergence on the weekly RSI. A textbook falling wedge pattern. And open interest that’s creeping up as price drops—a telltale sign of smart money accumulation. This isn’t random noise. It’s the market setting a trap for overzealous shorts.
Of course, none of this matters if Bitcoin decides to impersonate a falling knife. And let’s be real—when has the crypto market ever followed a script? But for once, the math favors the bulls. Just in time for Wall Street to 'discover' crypto again after the next 20% pump.
Why XRP price crashed
Ripple token crashed primarily because of the ongoing weakness in the crypto market. Bitcoin, which drives the crypto market, dropped from the all-time high of $123,200 to $112,000.
Other top cryptocurrencies like Solana, Ethereum, and Avalanche have also dropped in the past few days.
The decline also coincided with the performance of the stock market as the Nasdaq 100 and Dow Jones fell by over 500 points on Friday.
Market participants are reacting to signs that the American economy was slowing because of Donald Trump’s tariffs. For example, the economy averaged 35,000 jobs in the last three months, the lowest level since 2020. This weakness could continue as tariffs rise.
XRP price also plunged after insider sales. Larsen sold tokens worth over $140 million at its top. It is common for investors and insiders to sell some of their assets when they surge.
Third-party data shows that XRP has strong fundamentals, which may help to offset the ongoing weakness. For example, Polymarket data shows that the odds of the SEC approving spot XRP ETFs have jumped to over 80%.
More data shows that Ripple USD (RLUSD), its stablecoin, is gaining traction, with its market capitalization surpassing the $600 milestone just a few months after its launch.
Ripple price technical analysis points to a rebound
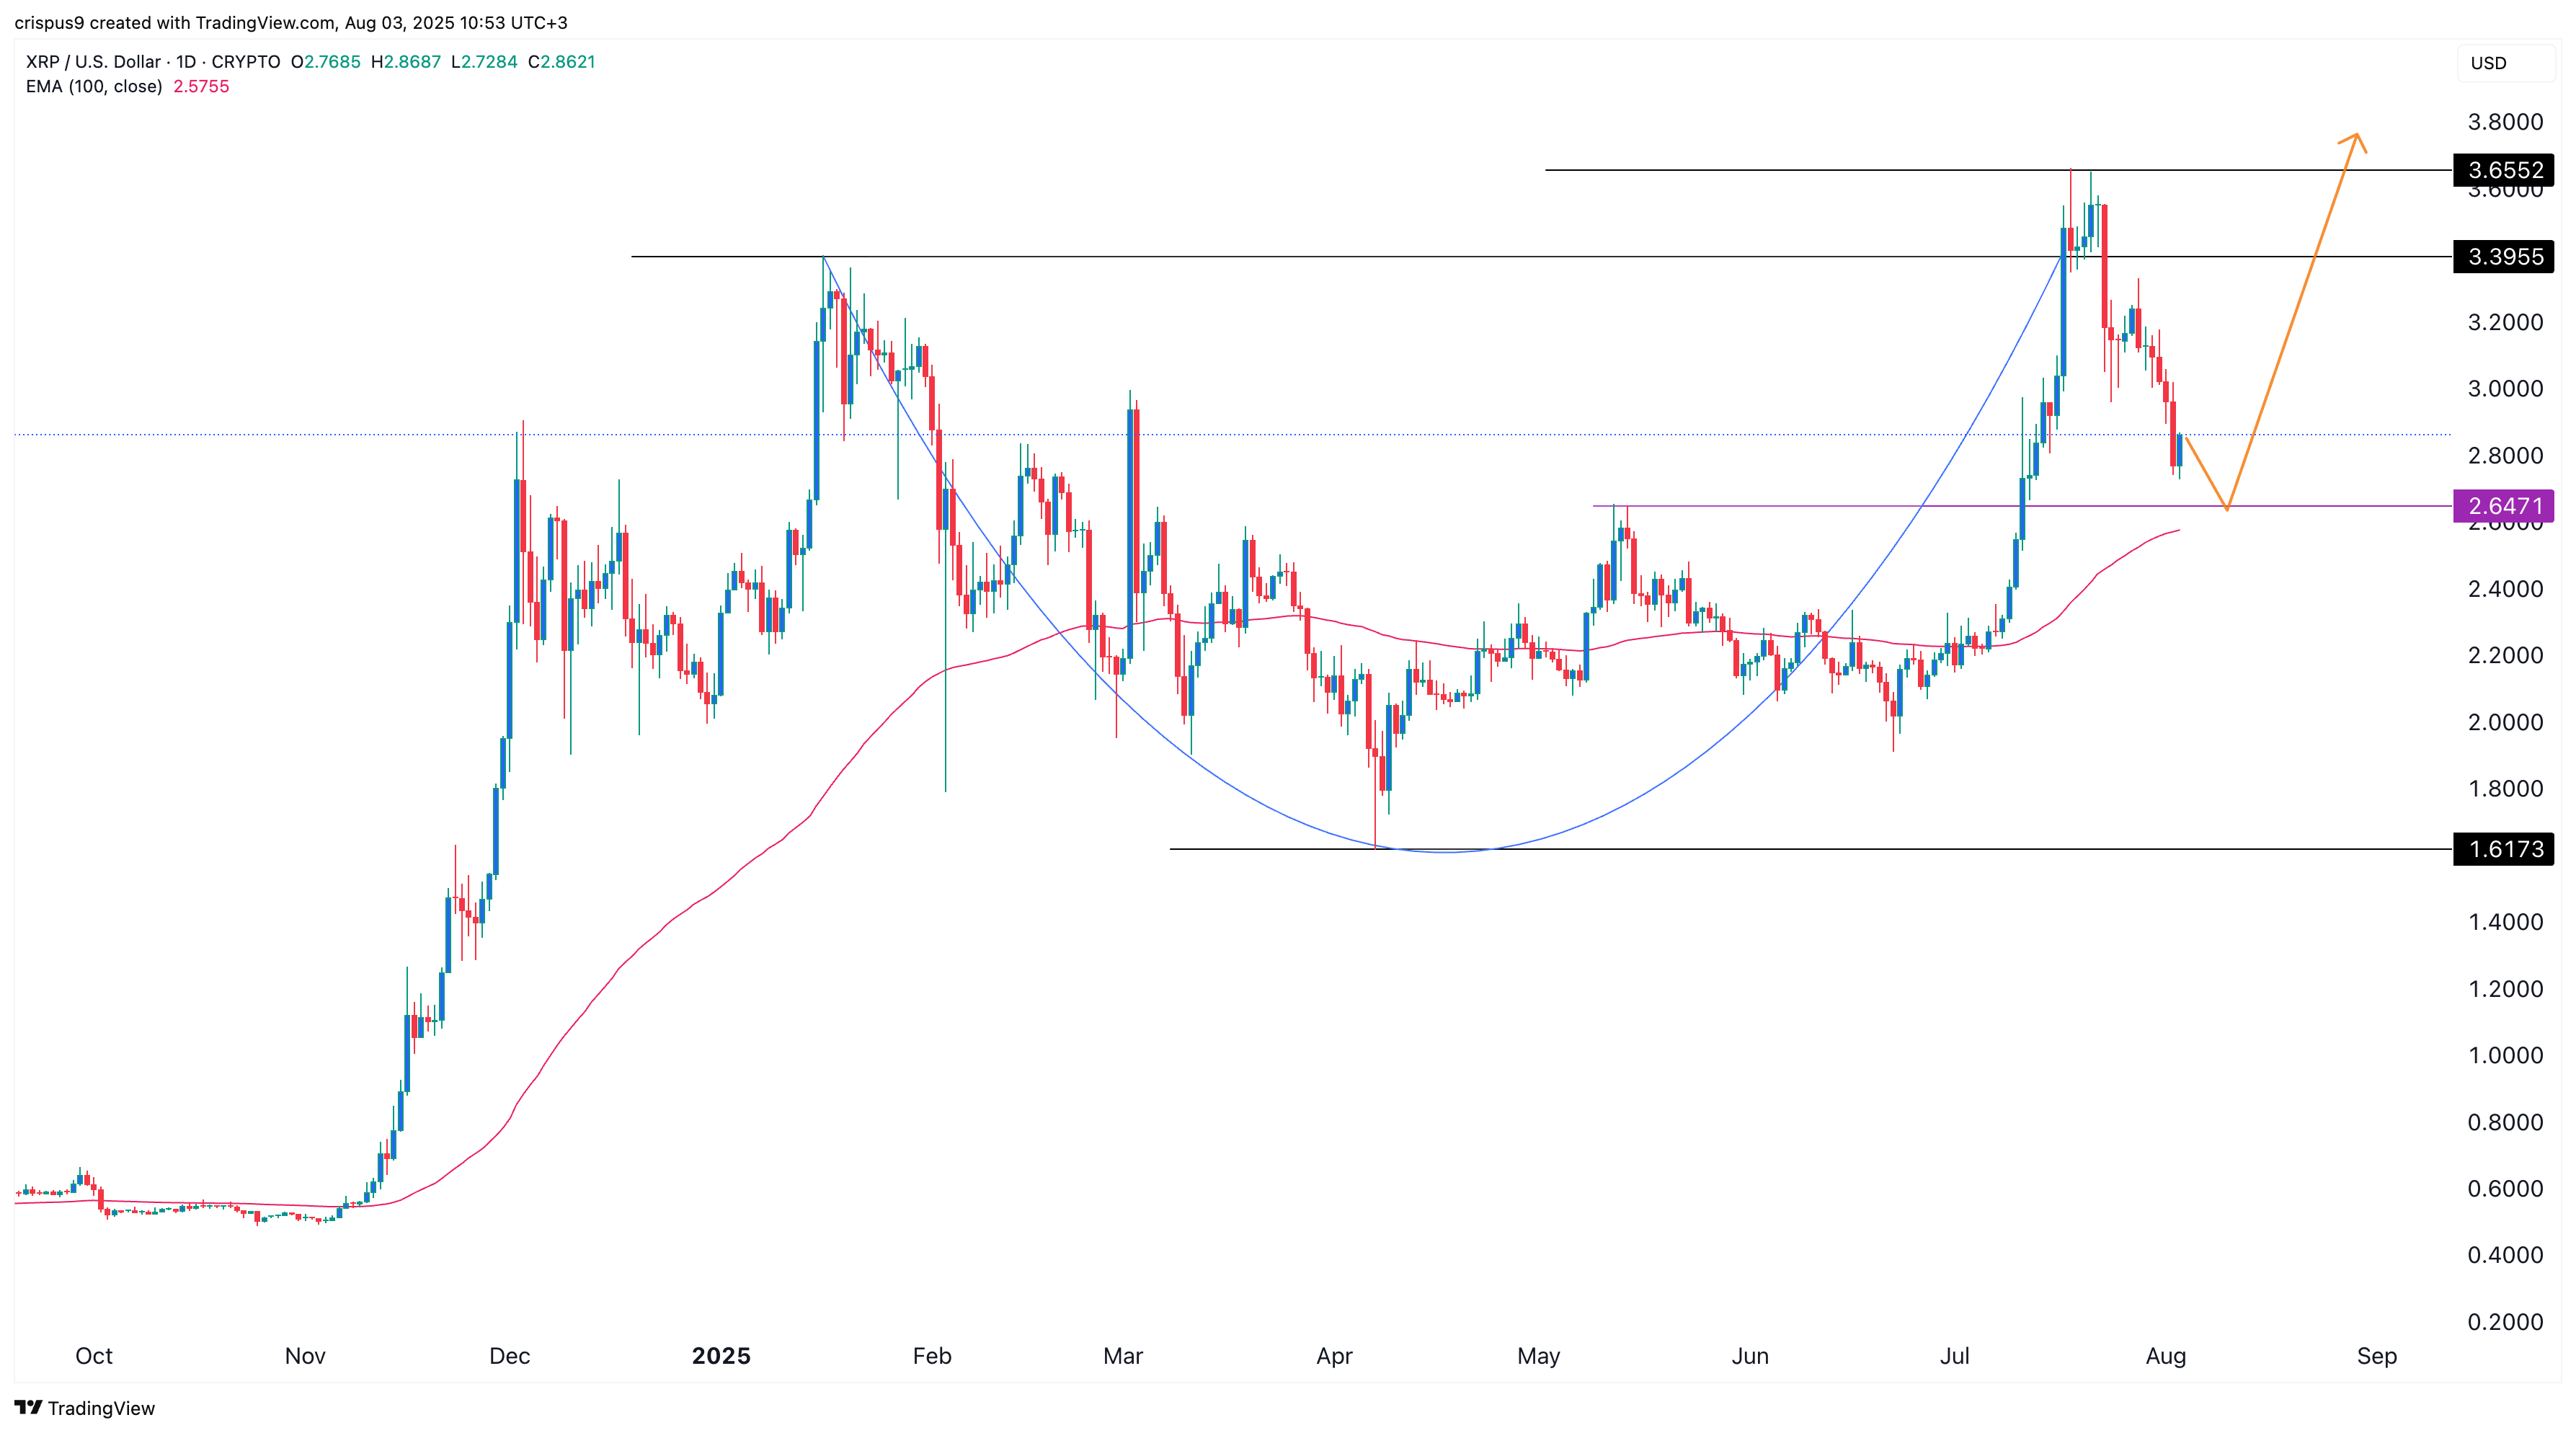
The daily chart provides a clearer reason why the xrp price is falling and why it may rebound soon.
This chart shows that the token bottomed at $1.6173 on April 7 and then bounced back to a high of $3.6552 on July 18. It has formed a cup-and-handle pattern, a popular continuation sign.
The ongoing pullback was likely part of the formation of the handle section of this pattern. It also dropped as it formed mean reversion, a situation where an asset drops back to its historical moving averages.
Therefore, XRP price will likely bounce back, and first retest the upper side of the cup at $3.3955 followed by the year-to-date high of $3.6552.
