🚀 OMNI Skyrockets 120% Post-Upbit Listing: Here’s Why Traders Are FOMOing In

Upbit's latest listing sends OMNI into orbit—technical breakout suggests this altcoin's just getting started.
Pattern recognition pays (until it doesn't)
The chart paints a bullish picture: a textbook breakout formation hints at 120% upside from current levels. Suddenly, everyone's a technical analyst—except the guys who bought the top.
Exchange listings: The ultimate price catalyst (until the dump)
South Korea's largest crypto platform flexes its market-moving muscles again. Liquidity floods in, algorithms front-run retail, and the cycle continues—modern finance at its finest.
OMNI's pumping while traditional markets nap. Maybe those 'digital gold' maximalists were onto something after all.
Why did OMNI price soar?
OMNI price surged sharply after South Korea’s largest crypto exchange, Upbit, introduced a KRW trading pair for the token early yesterday.
The listing substantially increased OMNI’s exposure to Korean retail investors, a market known for fueling speculative rallies. Upbit’s dominant position in the region likely lent institutional credibility to the token, prompting a surge in investor interest and trading activity.
According to data from CoinGecko, Upbit accounted for the majority of OMNI’s trading volume over the past 24 hours, recording approximately $290 million, significantly higher than Binance, which registered $192.7 million during the same period.
OMNI price also gained traction as open interest surged to an all-time high of over $75 million, rising more than 370% in the past 24 hours per CoinGlass data. Despite a persistently negative weighted funding rate, indicating a market skewed toward short positions, the sharp buildup in open interest likely fueled a short squeeze, driving prices higher as traders rushed to cover their positions.
Omni Network recorded over $10.62 million in liquidations within the past 24 hours, with approximately $7.66 million attributed to liquidated short positions as bearish traders faced significant losses amid the unexpected price rally.
OMNI price action
The recent Upbit listing has acted as a major catalyst for OMNI, pushing the token above a key resistance level on the daily chart that had previously capped its rallies.
Since early June 2024, OMNI had been trading within a falling wedge pattern, a bullish reversal formation characterized by converging downward-sloping trendlines. The token attempted to break out of this pattern twice, once in December 2024 and again on July 11 this year, but failed to sustain momentum on both occasions.
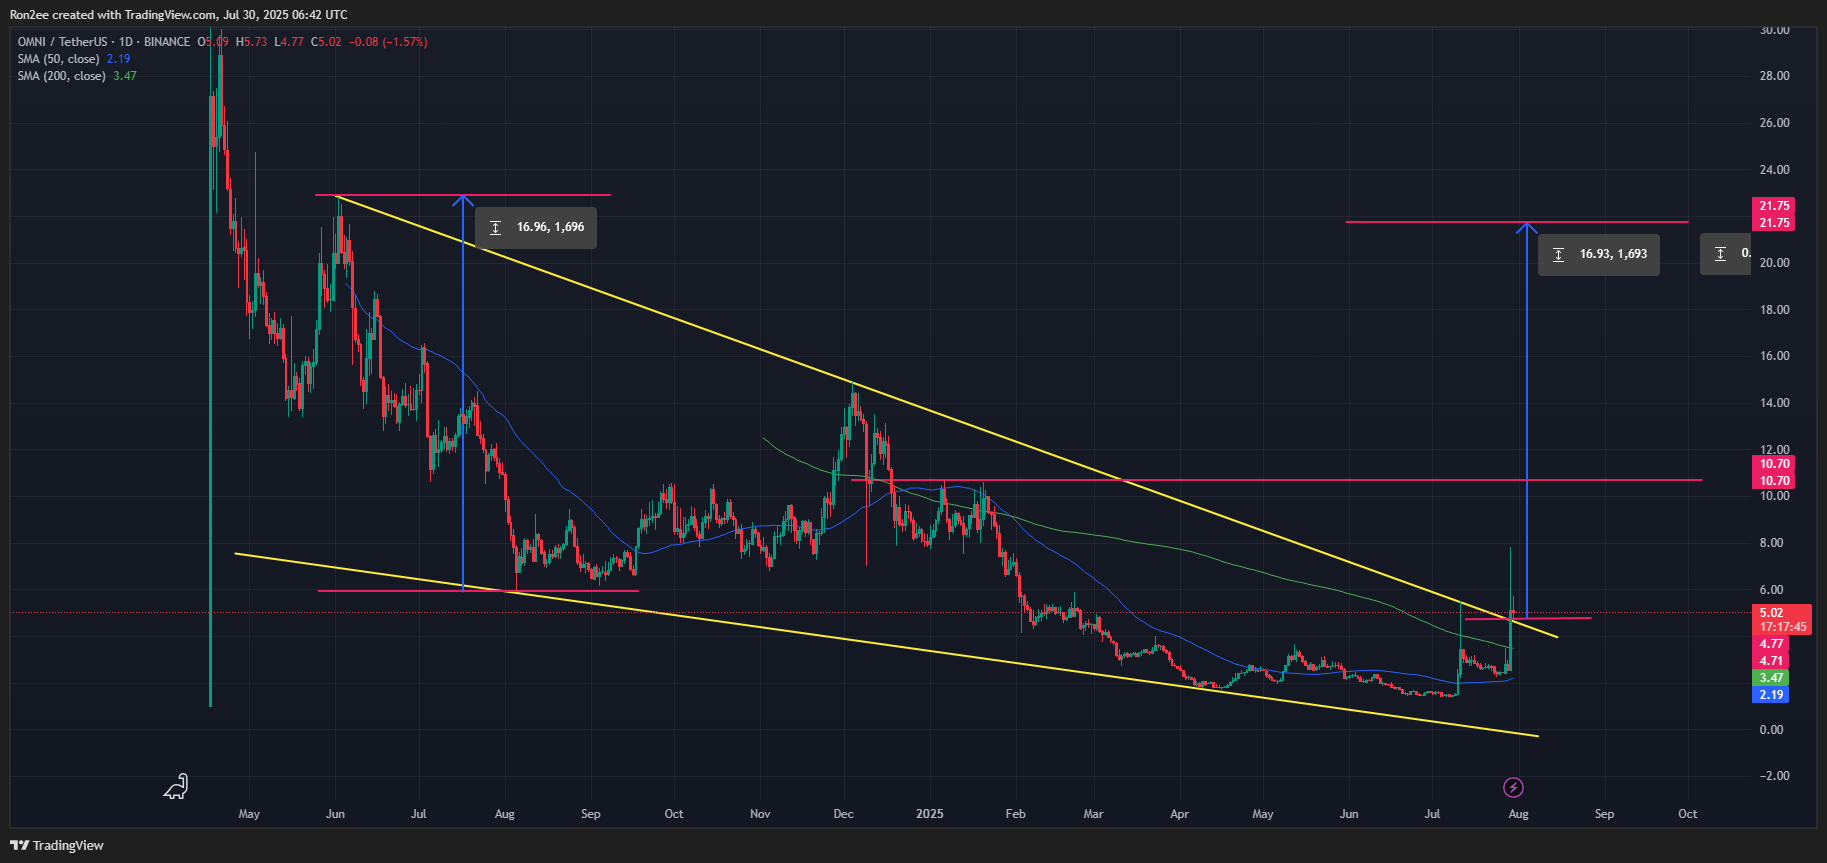
This time, however, OMNI decisively broke above the upper trendline of the wedge at $4.77 on July 29. The breakout was followed by a successful retest of the same level, which has now turned into a support zone, further validating the pattern.
Technical indicators continue to back the bullish case for OMNI. The price has moved firmly above its 50-day and 200-day simple moving averages, which market watchers often view as a confirmation of a developing uptrend.
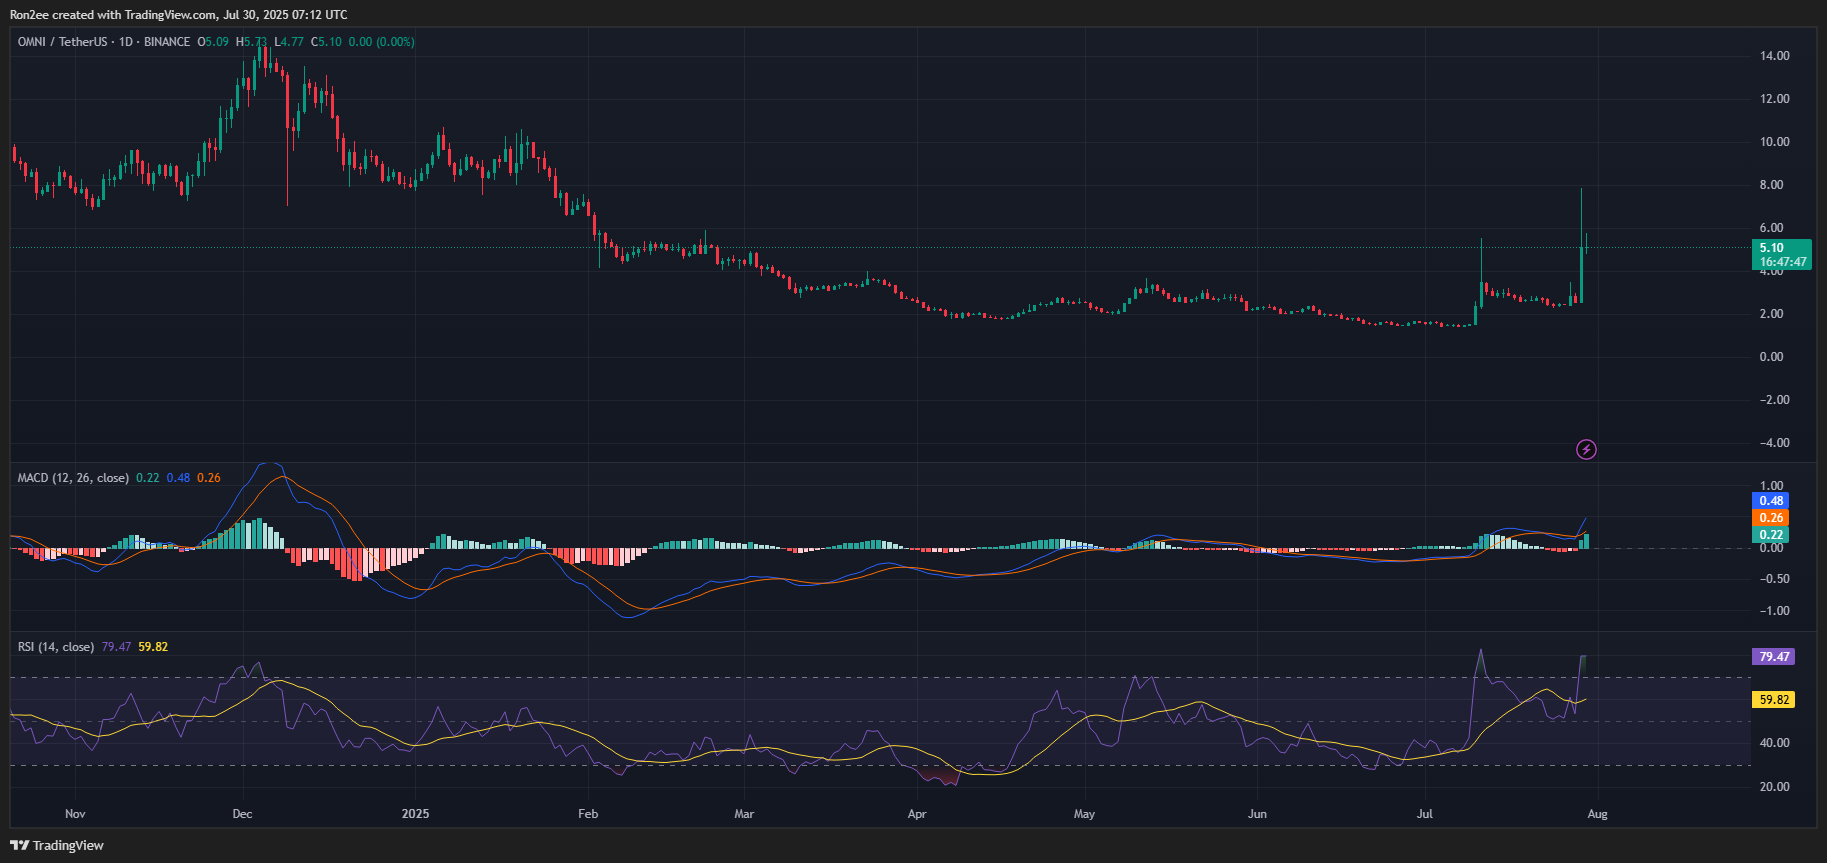
Addilonally, the Moving Average Convergence Divergence lines are trending upward, with growing green histogram bars indicating that bulls are still in control.
Given the strength of the breakout, the next major target lies at $10.70, which represents a 120% upside from current levels and aligns with its immediate path of least resistance. If bullish momentum continues, the full upside projection from the wedge pattern places the long-term target around $21.75.
However, with the RSI reading above 70, OMNI is currently overbought, which is not uncommon for a crypto asset that is within a strong uptrend. As such, a short pull-back shouldn’t be ruled out, especially as momentum cools and profit-taking sets in.
Disclosure: This article does not represent investment advice. The content and materials featured on this page are for educational purposes only.

Log in to Reply
Log in to comment your thoughtsComments
Related Articles
|Square
Get the BTCC app to start your crypto journey
Get started today Scan to join our 100M+ users