Ethereum Pulls Back from $3,900 Peak—But Shrinking Exchange Reserves Hint at Another Leg Up

Ethereum takes a breather after flirting with $3,900—but don't call it a reversal just yet. Exchange reserves are drying up faster than a DeFi yield farm in a bear market, and that usually means one thing: bulls aren't done.
The Dip Before the Storm?
Sure, ETH retreated from its local top. But crypto's favorite smart contract platform has a habit of shaking out weak hands before ripping higher. With fewer coins sitting on exchanges—aka 'sell pressure fuel'—the path of least resistance looks... up.
Traders vs. HODLers: The Eternal Tug-of-War
While day traders sweat over 5-minute candles, the big money's playing chess. Those dwindling exchange reserves? That's institutions and whales moving coins into cold storage—the crypto equivalent of loading a cannon. Because nothing says 'I believe' like making your assets purposefully illiquid (and giving your accountant nightmares).
One rule hasn't changed since the Mt. Gox days: when coins leave exchanges, rallies follow. Whether ETH retests $3,900 or takes a detour to shake out more paper hands, the setup screams accumulation. Just maybe keep some dry powder for when Wall Street 'discovers' this trend next quarter.
1M ETH withdrawn from exchanges in one month
In the last 30 days, more than 1 million ETH have been taken out of centralized exchanges, according to a July 28 X post by analyst Ali Martinez. A steep drop in exchange-held reserves usually indicates that investors are shifting assets into non-custodial wallets or cold storage.
More than 1 million Ethereum $ETH have been withdrawn from crypto exchanges in the past month! pic.twitter.com/rP18ToPz7V
— Ali (@ali_charts) July 28, 2025Frequently seen as an indication of long-term accumulation, this pattern lessens immediate sell-side pressure and may pave the way for future price increases.
In addition, Ethereum spot exchange-traded funds are still a source of strong demand. According to SoSoValue data, July 28 saw $65.14 million in net inflows. Total inflows for July have now crossed $5.1 billion, showing continued interest from institutional investors. This may help stabilize market confidence even in the face of short-term volatility.
Ethereum technical analysis
Ethereum’s strong upward trend is supported by its position above all significant moving averages on the daily chart. Trend alignment over timeframes is confirmed by ETH trading above its 10-, 20-, 50-, and 200-day EMAs and SMAs.
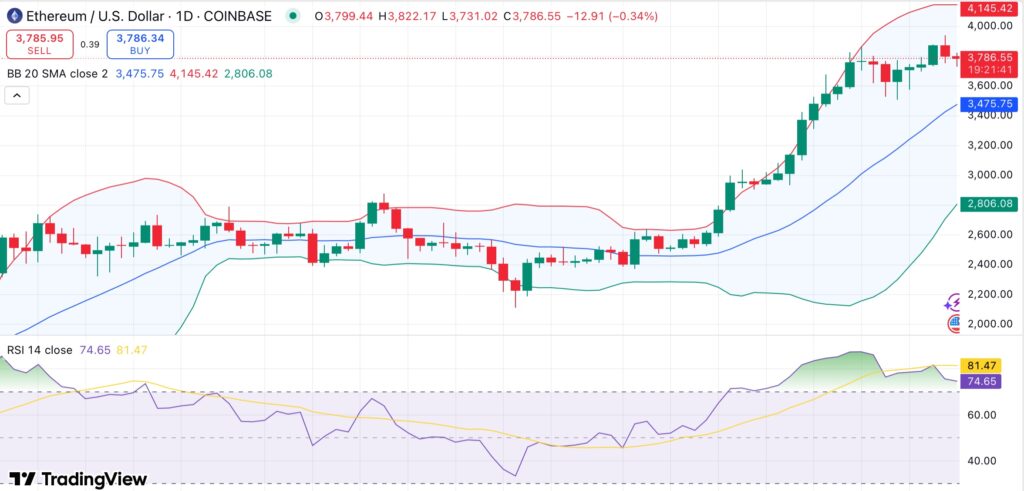
On the other hand, short-term oscillators show signs of fatigue. The relative strength index has reached overbought territory at 74.6 and the stochastic oscillator is getting close to 89, both of which point to a slowdown in the upward momentum.
These readings suggest that ETH may experience a brief decline or a period of consolidation before attempting higher levels. The MACD is still bullish with a strong positive crossover, but other indicators, like the stochastic RSI, are flattening, indicating potential hesitancy.
Ethereum is trading close to the upper Bollinger Band, which usually signals the start of a cooling-off period or a price reversion. If that happens, the $3,680–$3,700 range, which corresponds to the 10-day EMA, provides immediate support.
A sustained decline below that might trigger a more significant correction toward $3,480, but either macro pressure or an ETF demand reversal WOULD likely be necessary for such a move.
On the upside, $4,000 would once again come into focus with a confirmed breakout above $3,960. The next leg of ETH’s move could aim for $4,200–$4,300 if volume picks back up and momentum stabilizes.
