XRP Primed for $5 Surge as Ripple Reveals 4 Rare Chart Patterns – Bullish Signals Flash

XRP just painted its most bullish technical setup in years—and traders are scrambling to decode the implications.
The patterns that scream 'breakout'
Four rare formations appeared simultaneously on Ripple's charts: a descending wedge breakout, bullish pennant, inverse head-and-shoulders, and golden cross. When these converge, they typically precede violent upside—the kind that could propel XRP toward its $5 price target.
Why this isn't your average crypto pump
Unlike meme coins that rally on Elon Musk tweets, these technical signals emerge from sustained accumulation. Institutional flows into Ripple's ODL corridors suggest real-world utility might finally catch up to the hype.
The cynical footnote
Of course, in crypto-land, even the prettiest charts can get rug-pulled by a single SEC filing. But for now, the algorithms are buying—and that's all that matters until the next 'unexpected' regulatory curveball.
XRP price technical analysis
The XRP token has formed at least for highly bullish chart patterns that signal more gains ahead:
- Golden cross
- Bullish pennant.
- Cup and handle.
- Bullish flag.
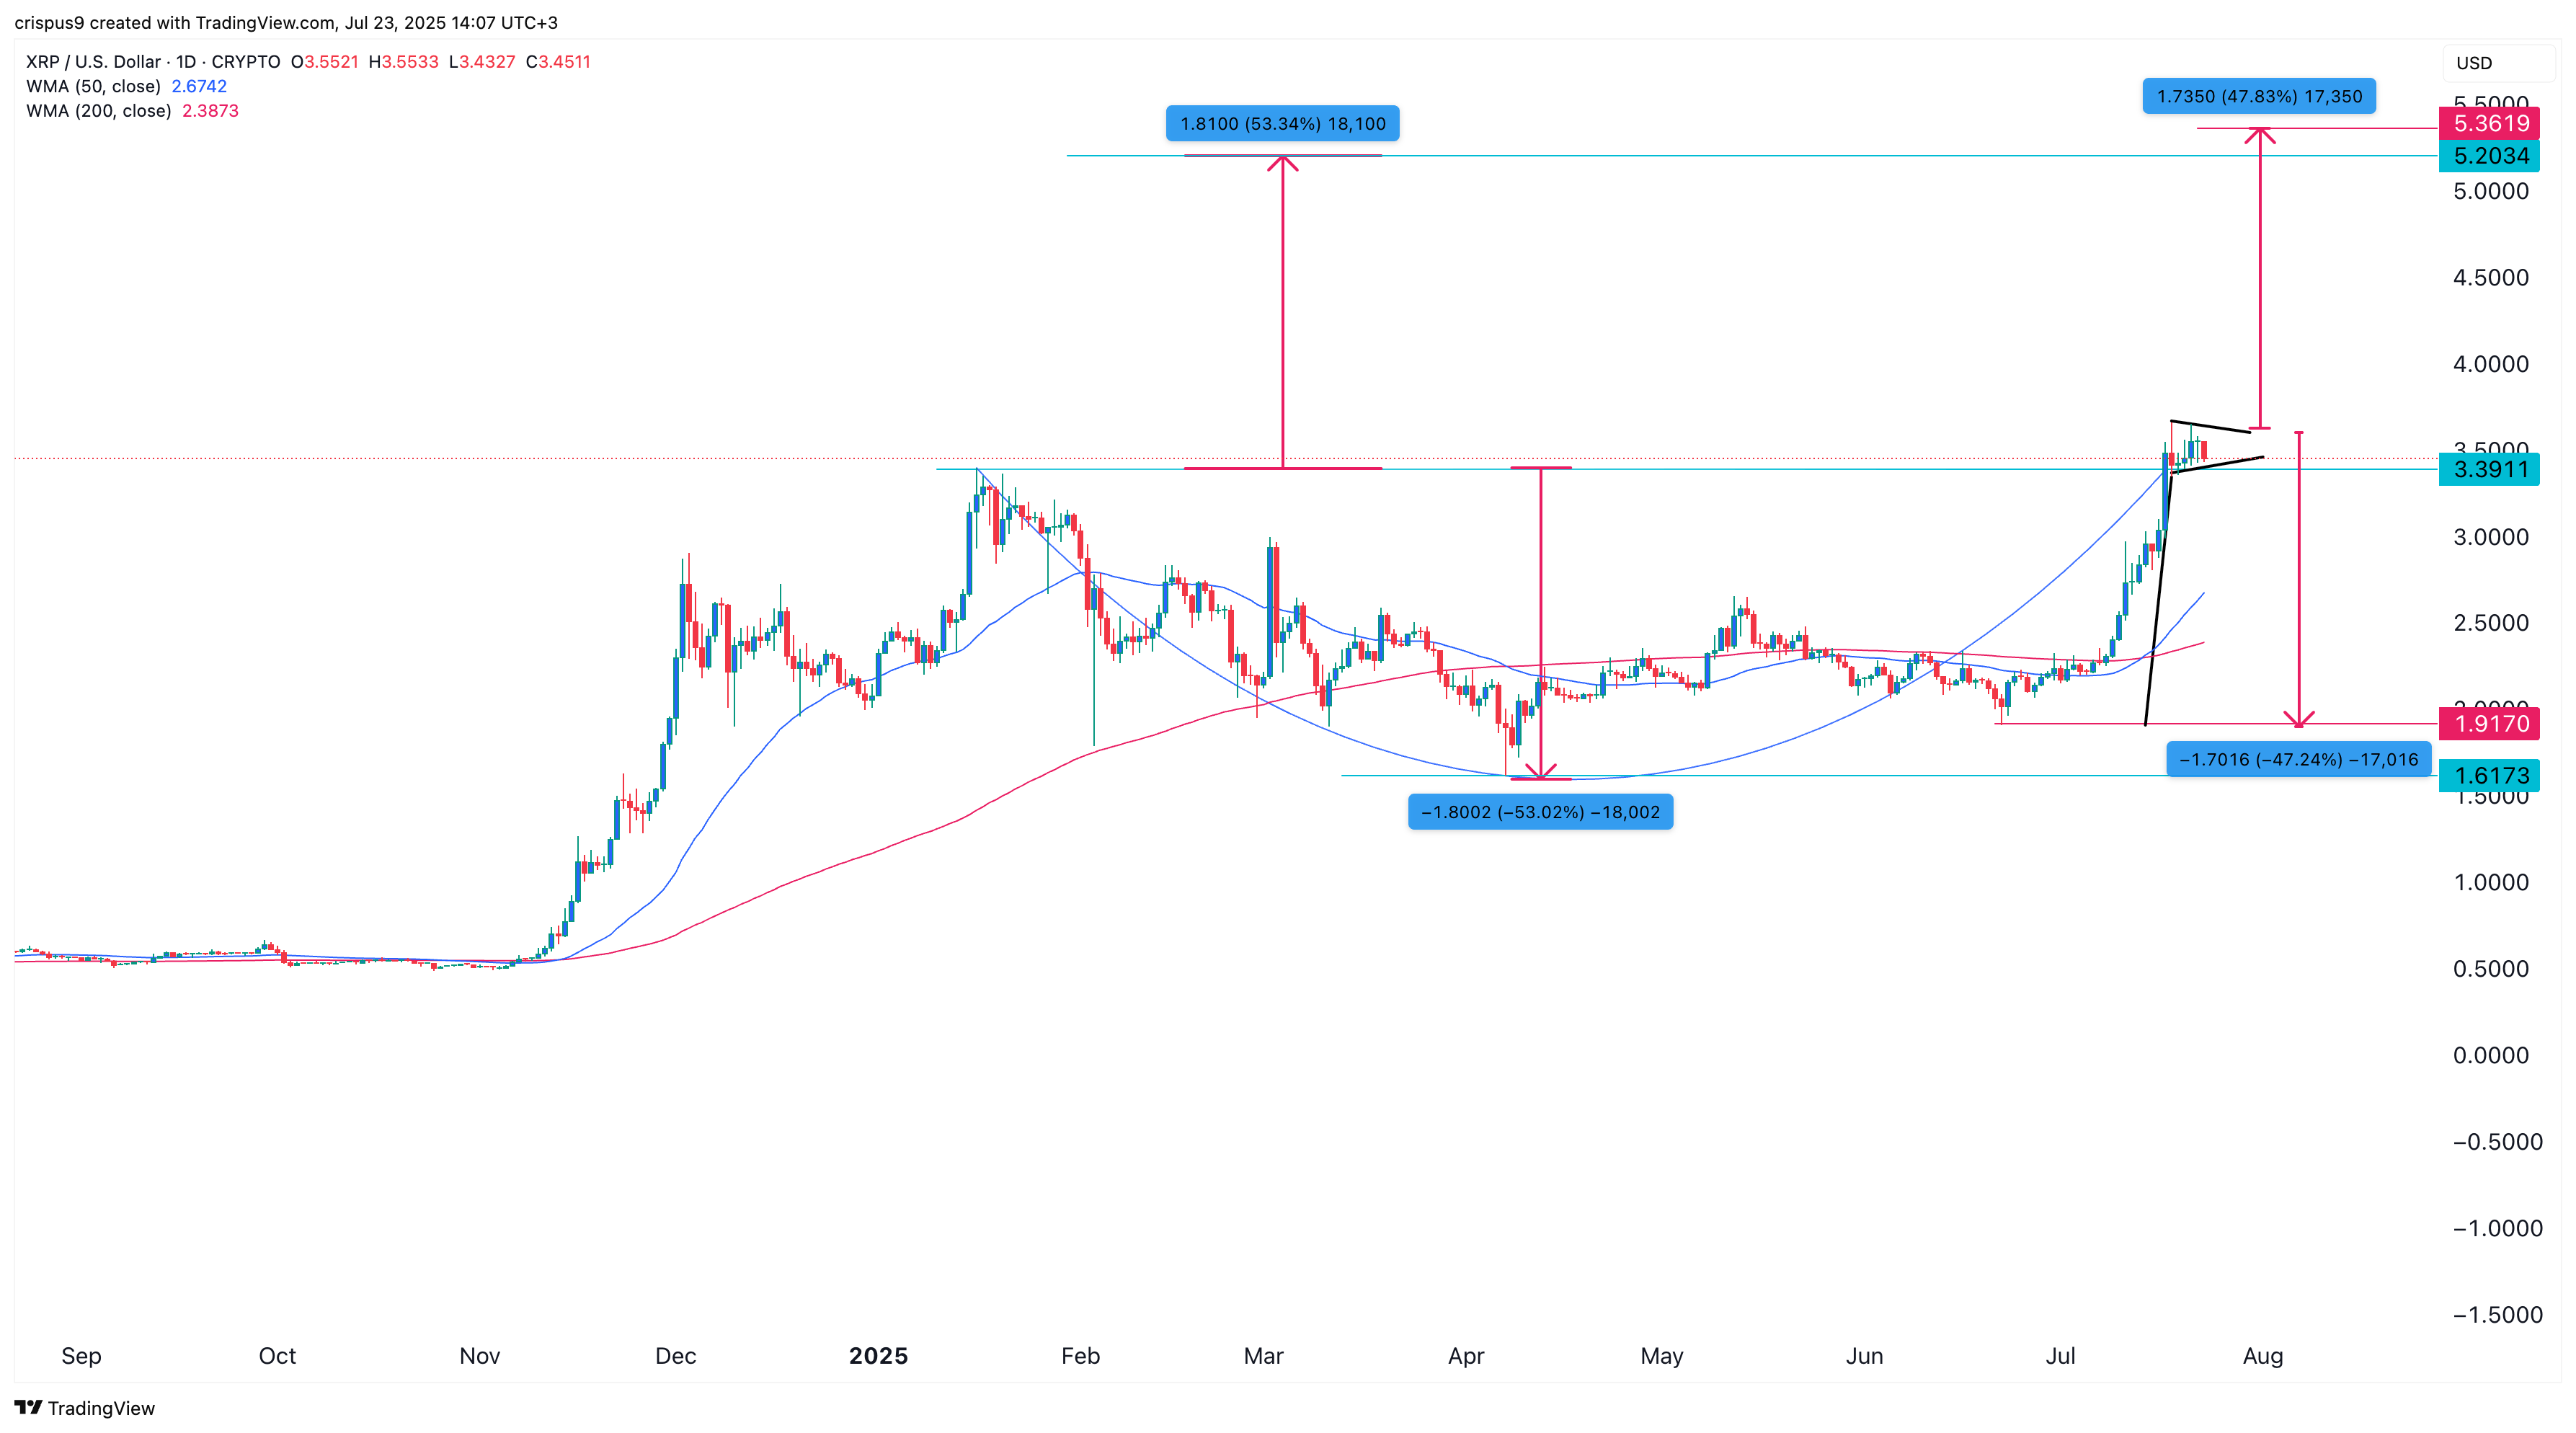
The daily chart shows that the coin formed a golden cross pattern on July 11 as the 50-day Weighted Moving Average crossed above the 200-day one. This price action was a sign of the rally’s ongoing strength. In most periods, this pattern often leads to more gains. For example, XRP price jumped by over 500% after forming the golden cross in November last year.
XRP has also formed a highly bullish cup-and-handle pattern, with its upper side at $3.39 and the lower level at $1.6173. This pattern has a depth of approximately 53%, indicating that its target price is $ 5.20.
The coin is now in the process of forming a bullish flag pattern, which comprises of a vertical line and some consolidation. This pattern often leads to more upside, with the target price being equal to the length of the flagpole. In this case, the flagpole’s length is 47%, giving the price target at $5.36.
Finally, the XRP price formed a giant bullish pennant between November last year and July this year. The triangular section of this pattern was formed over a period of seven months.
In addition to this, the coin has also been forming an Elliott Wave impulse and has now completed the third phase. This means that it may have a brief pullback to FORM the fourth wave and then resume the rebound.
Ripple price has key catalysts for more gains
The XRP price has numerous bullish catalysts that may propel it much higher in the coming weeks. The most notable one is that the Polymarket odds for a spot XRP approval has jumped to over 80%.
Current data indicate that XRP ETFs are likely to be successful. For one, spot Bitcoin and ethereum ETFs have already attracted over $65 billion in combined inflows. ETH ETFs have added close to $8 billion, a sign that investors are interested in altcoin funds.
The recently launched Teucrium 2X XRP ETF has also gained over $500 million in assets in the last three months. As such, Wall Street investors, who remained in the sidelines for years, will likely embrace top cryptocurrencies as viable alternative assets.
Further, XRP Ledger is gaining market share in the decentralized finance industry, a trend that may continue with the recent Wormhole integration.Its total value locked in the industry has increased by over 72% in the past 30 days to $93 million, with its stablecoin supply surpassing $93 million.
The XRP price will also benefit from the recently approved GENIUS Act, which is expected to streamline the stablecoin industry, where Ripple aims to dominate. The Ripple USD stablecoin’s market cap has gained over $520 million in assets.

Log in to Reply
Log in to comment your thoughtsComments
Related Articles
|Square
Get the BTCC app to start your crypto journey
Get started today Scan to join our 100M+ users