FLOKI Primed for 52% Rocket Ride After Smashing Through Critical Trendline Barrier

FLOKI isn't just barking—it's ready to bite. The meme coin just shattered a key resistance level, setting the stage for a potential 52% moonshot. Traders are scrambling as the chart paints its most bullish picture in months.
Breaking the trendline curse
After multiple failed attempts, FLOKI finally conquered its descending trendline resistance. This isn't just technical analysis voodoo—it's the kind of breakout that makes chartists drool into their triple-shot espressos.
52% or bust
The measured move target now sits at that juicy 52% upside level. Of course, in crypto-land, 'measured moves' sometimes turn into 'massive overreactions'—but who's complaining when the numbers are green?
Just remember: in a market where 'fundamentals' can mean a viral tweet about a dog, even technicals start looking like solid ground. FLOKI's either about to make traders look like geniuses... or provide perfect 'I told you so' material for the crypto skeptics.
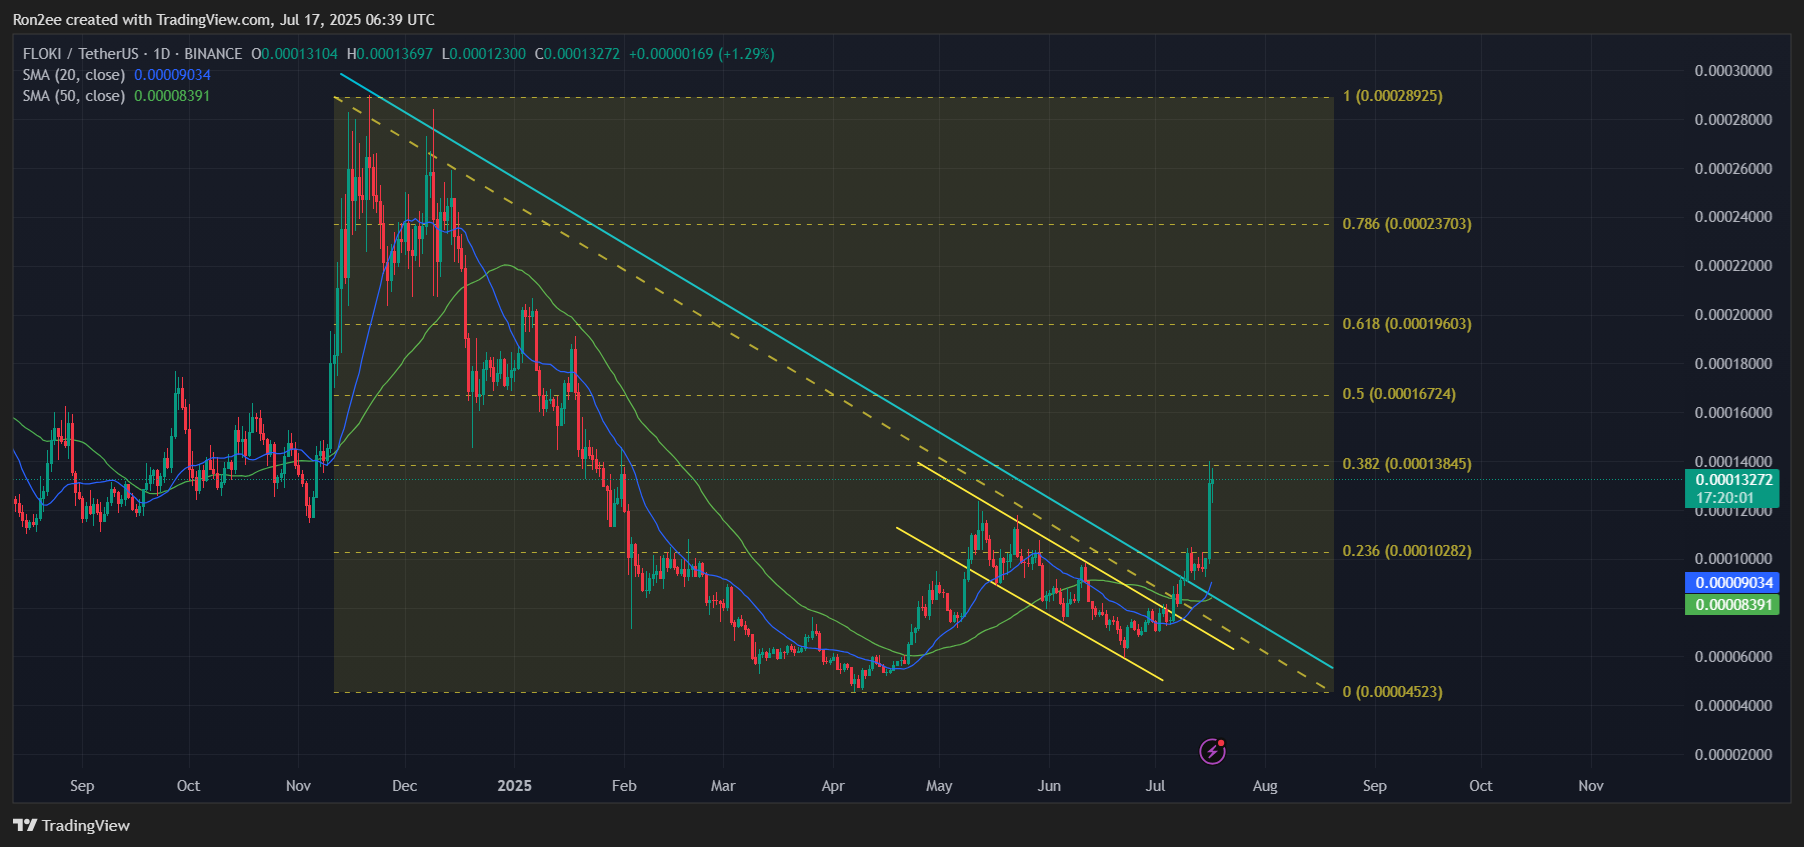 FLOKI price 20-day and 50-day SMA chart — July 17 | Source: crypto.news
The chart shows that FLOKI has been stuck in a downtrend since late 2023, consistently printing lower highs and lower lows. But that trend began to reverse in mid-May when FLOKI started forming higher lows, an early clue that buyers were stepping back in.
The breakout in early July marked a major change in structure, and the successful retest confirmed that the former resistance had now flipped into support.
At the moment, FLOKI is holding firm above the $0.00012 level, comfortably above the trendline it broke out from. That line had capped price action for months, but now appears to be acting as a solid support.
FLOKI also broke out of a descending parallel channel that had been in play since May. It adds more weight to the bullish setup and suggests further upside could be on the cards.
Still, the memecoin is now facing resistance around the 61.8% Fibonacci retracement level at $0.000167. A daily close above this level could open the door to the 78.6% Fib level at $0.000196, which WOULD be roughly 52% higher than the current price level.
Technicals flash bullish signs
From a technical standpoint, things are lining up in favor of the bulls. FLOKI recently flashed a golden cross on the daily chart, where the 20-day simple moving average crossed above the 50-day, often seen as a strong bullish signal.
FLOKI’s 20-day SMA has crossed above the 50-day SMA, a short-term bullish momentum signal often seen as a precursor to extended rallies.
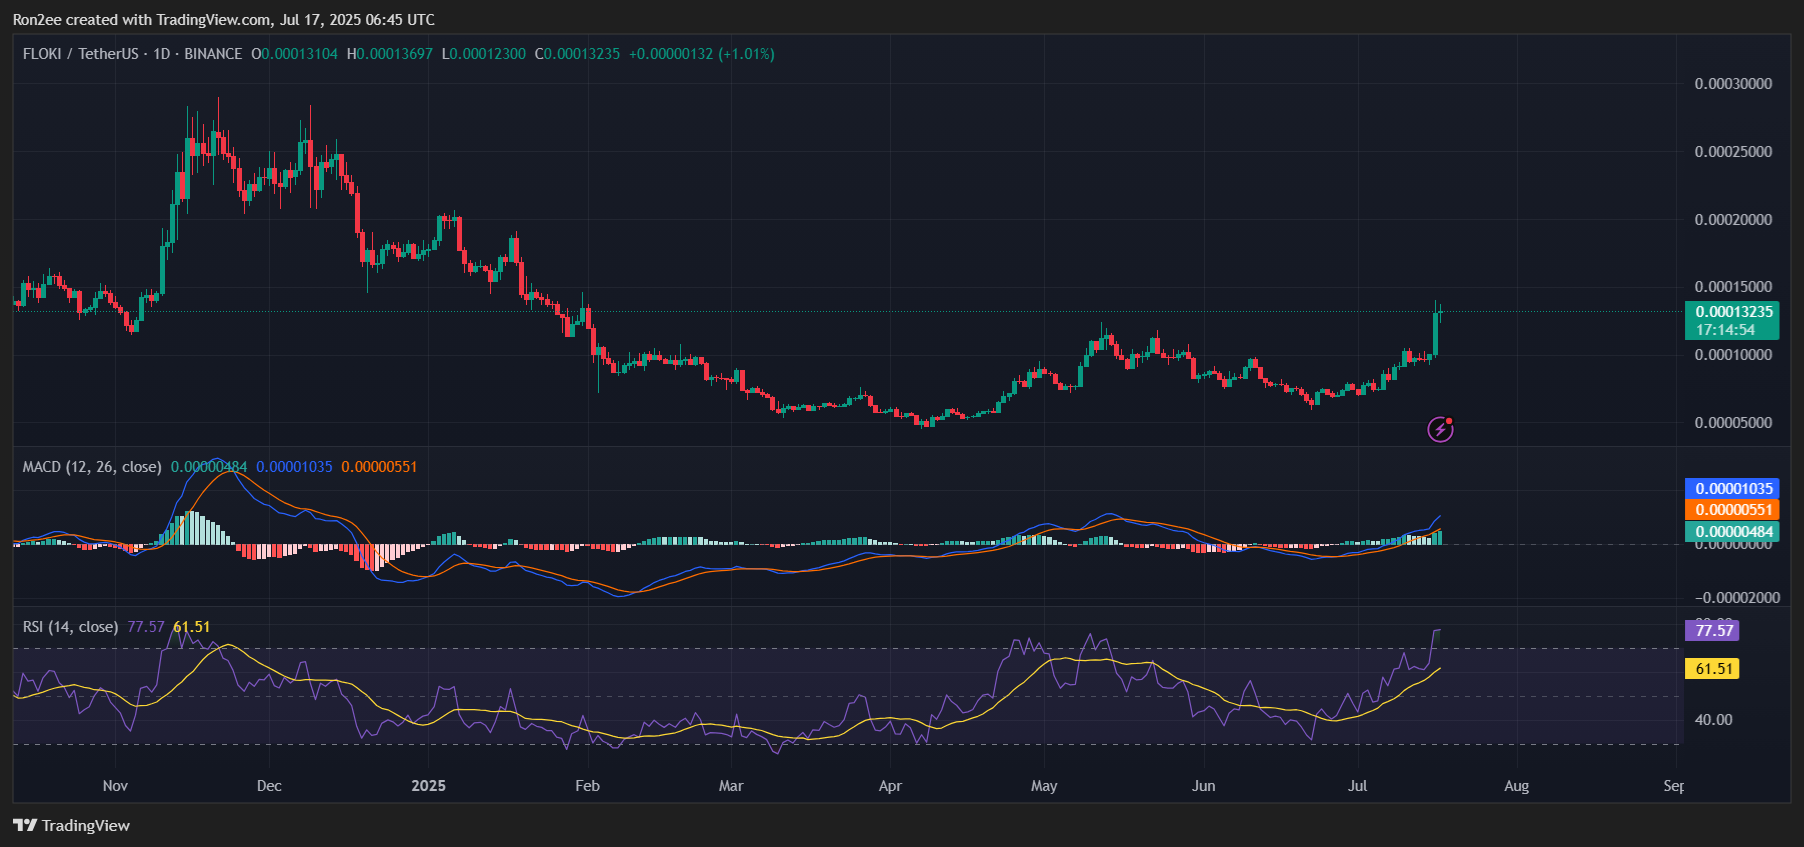
Momentum indicators are also showing strength. The MACD line remains above the signal line and is trending upward. This is a bullish signal that shows growing momentum. The RSI is currently at 74, which places FLOKI in overbought territory. However, in meme rallies, such levels often reflect strong buying pressure rather than an immediate reversal.
On the downside, if a pullback occurs, the $0.000102 level, marking the 50% Fibonacci retracement, could act as the next support.
Beyond the charts, there are several factors fueling FLOKI’s rally. Futures market open interest has soared to an all-time high of $76.7 million, up 88% over the past day alone. More importantly, funding rates have stayed positive for over a week, suggesting that traders remain confident in upside potential.
On-chain activity is also on the rise. Data from Nansen shows that daily active addresses have more than doubled today, a bullish sign indicating growing user engagement and network activity.
Additionally, speculation about a potential Robinhood listing has started to circulate on X. While no official announcement has been made, the rumors have been enough to stir up investor excitement and drive further demand for the token.
Disclosure: This article does not represent investment advice. The content and materials featured on this page are for educational purposes only.
