Bitcoin Battles Key Support Post-ATH: Can Bulls Defend This Zone for the Next Leg Up?

Bitcoin's bull run hits a speed bump as price tests a critical support level—will hodlers step in or let gravity take over?
The make-or-break moment
After kissing new all-time highs, BTC now flirts with levels that could either springboard the next rally or confirm a deeper correction. Trading volumes suggest whales aren't panicking... yet.
Technical tightrope walk
The $60K-$62K zone emerges as the line in the sand—a region packed with historical liquidity that's made or broken past cycles. Chartists eye the 200D MA lurking below like a safety net... or bear trap.
Market psychology at play
With leveraged longs getting squeezed, the real test comes from spot buyers. Institutional flows show modest accumulation—because nothing gets Wall Street's attention like a 10% discount on 'digital gold'.
As always in crypto, the 'support' could vanish faster than a hedge fund's ethics when quarterly bonuses are on the line. Will this retest become another buying opportunity or the start of a summer slump?
Key technical points
- Support Zone Confluence: Bitcoin is testing a region combining the value area low, VWAP, and 0.618 Fibonacci retracement.
- Market Auction Complete: Loss of value area high followed by a test of value area low confirms full market rotation.
- Range Support at $115,200: This is the key high time frame support to maintain bullish structure and keep the range intact.
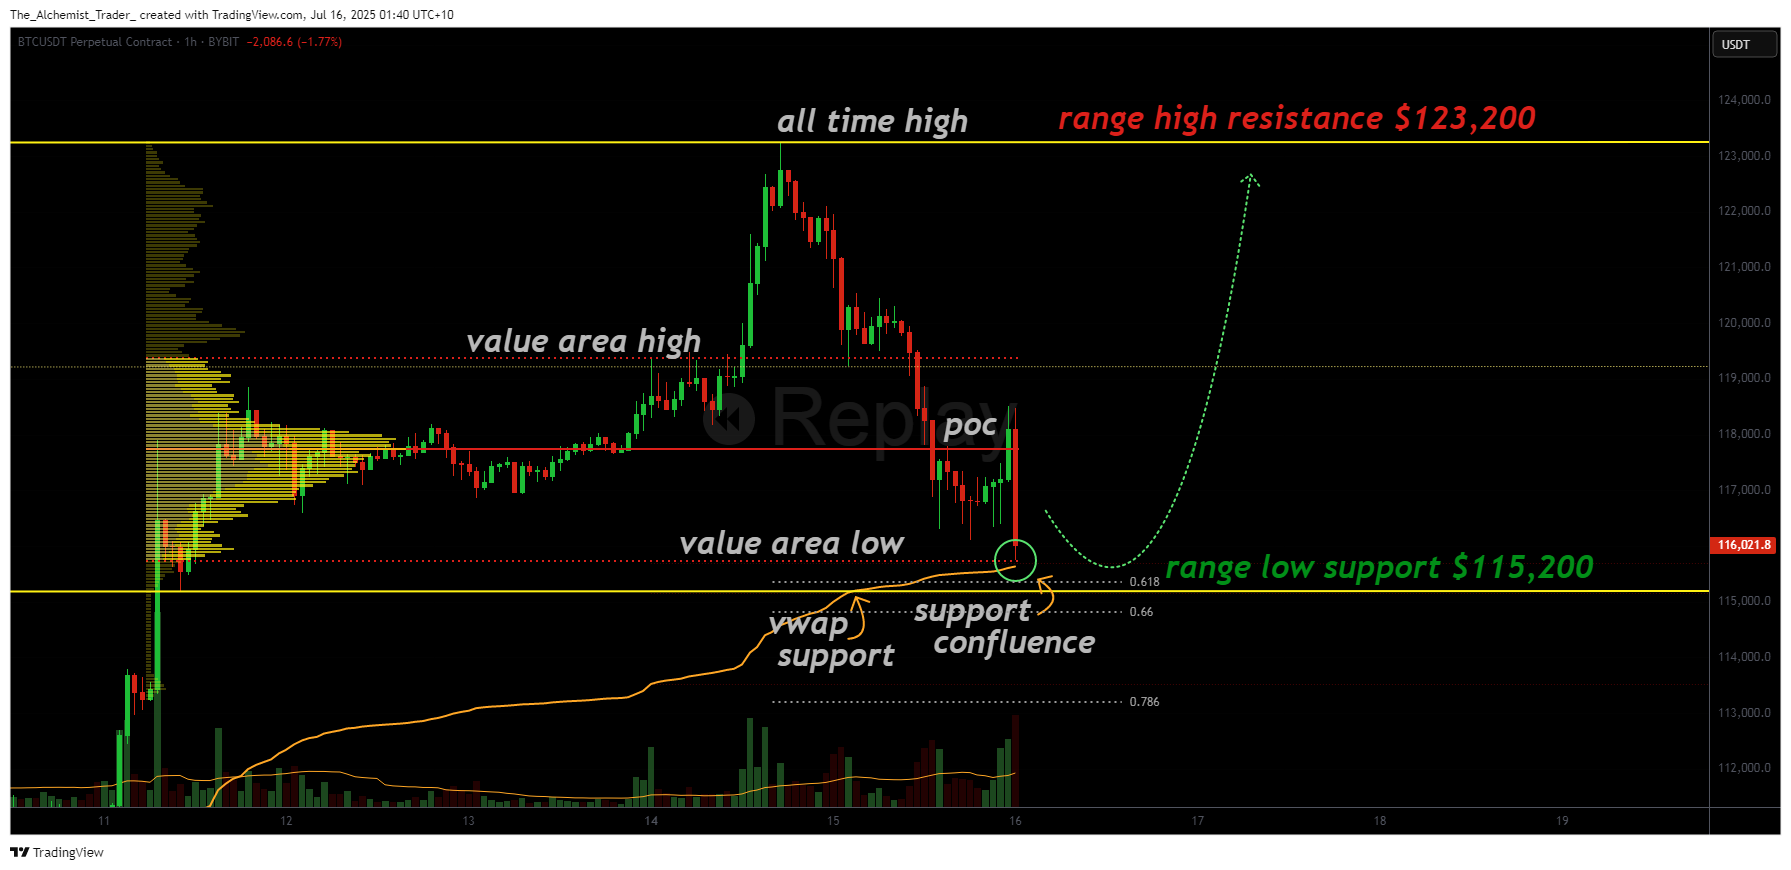
Bitcoin’s recent correction has brought price action back down into a critical technical support area after posting an all-time high around $123,000. This pullback aligns with standard market behavior following such a strong rally, but more importantly, the correction has reached a zone with strong technical overlap.
The support region around $115,200 includes the value area low, anchored VWAP support, and the 0.618 Fibonacci retracement from the previous impulse, all converging to FORM a potential bounce zone. This convergence increases the probability that the current dip could be a retracement rather than the beginning of a deeper reversal.
Additionally, the current correction has completed what’s known as a full market auction rotation. After losing the value area high, price has cycled through the range and tested the value area low, a typical pattern in sideways or range-bound markets. This structural behavior suggests bitcoin is still trading within a high time frame consolidation, rather than entering a full-blown downtrend.
As long as price holds above the range low near $115,200, the high time frame range remains intact. This opens the door for a possible rotation back toward the $123,000 resistance. Should bulls reclaim that level, a break into price discovery and a new all-time high becomes highly probable.
What to expect in the coming price action
Bitcoin must continue to hold above $115,200 to maintain the current range structure. If this support holds, a rotation back toward the $123,000 level is likely. A breakout above that resistance could trigger a fresh all-time high. However, if the current support zone fails, it WOULD break the range and potentially lead to deeper downside exploration.
