Solana Price Prediction This Week: Time to Buy or Dump Your Bags?

Solana's price action heats up as traders debate its next move. Will SOL break resistance or face a brutal rejection?
Bullish signals flash—but don't trust them blindly. The network's recent uptime streak fuels optimism, while whale accumulation hints at potential upside. Technicals suggest a make-or-break week ahead.
Bears whisper about overbought conditions and that one time the chain 'took a nap' during peak traffic. Meanwhile, degens FOMO into leveraged positions like it's 2021 all over again.
One thing's certain: Wall Street would charge you 2% management fee for this level of volatility. Place your bets—just don't mortgage your dog for SOL futures.
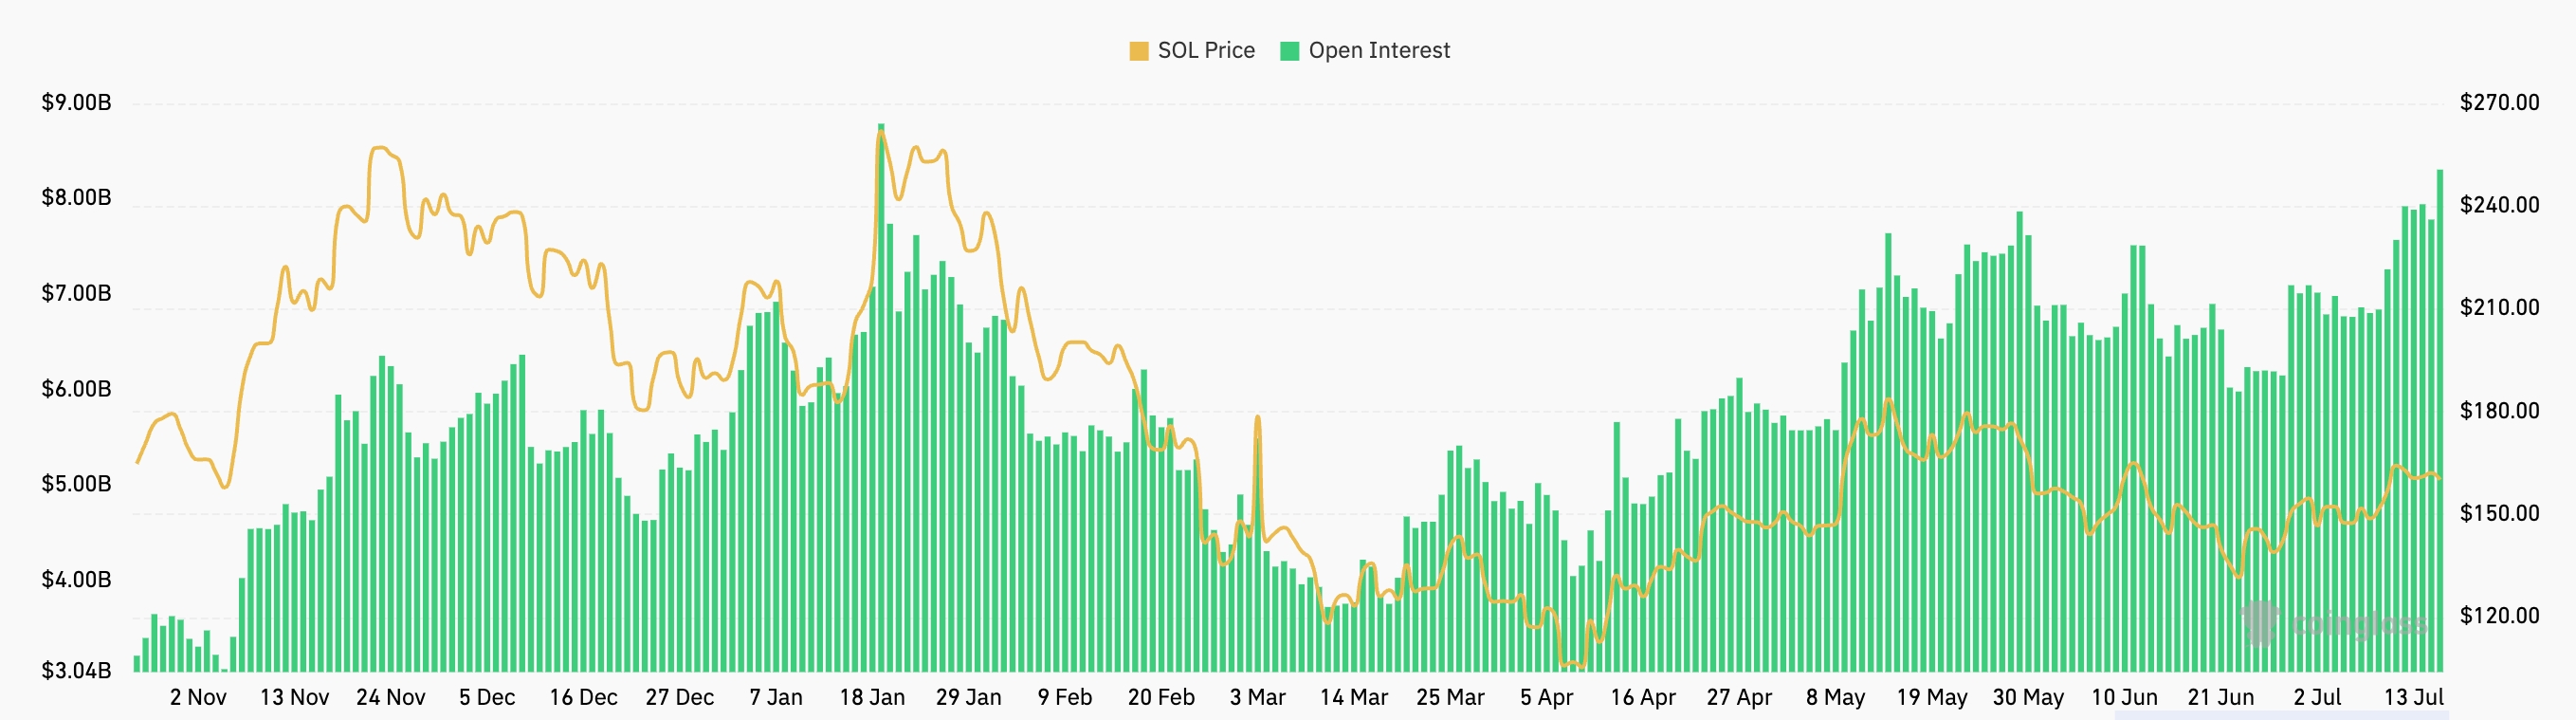 Slana open interest | Source: CoinGlass
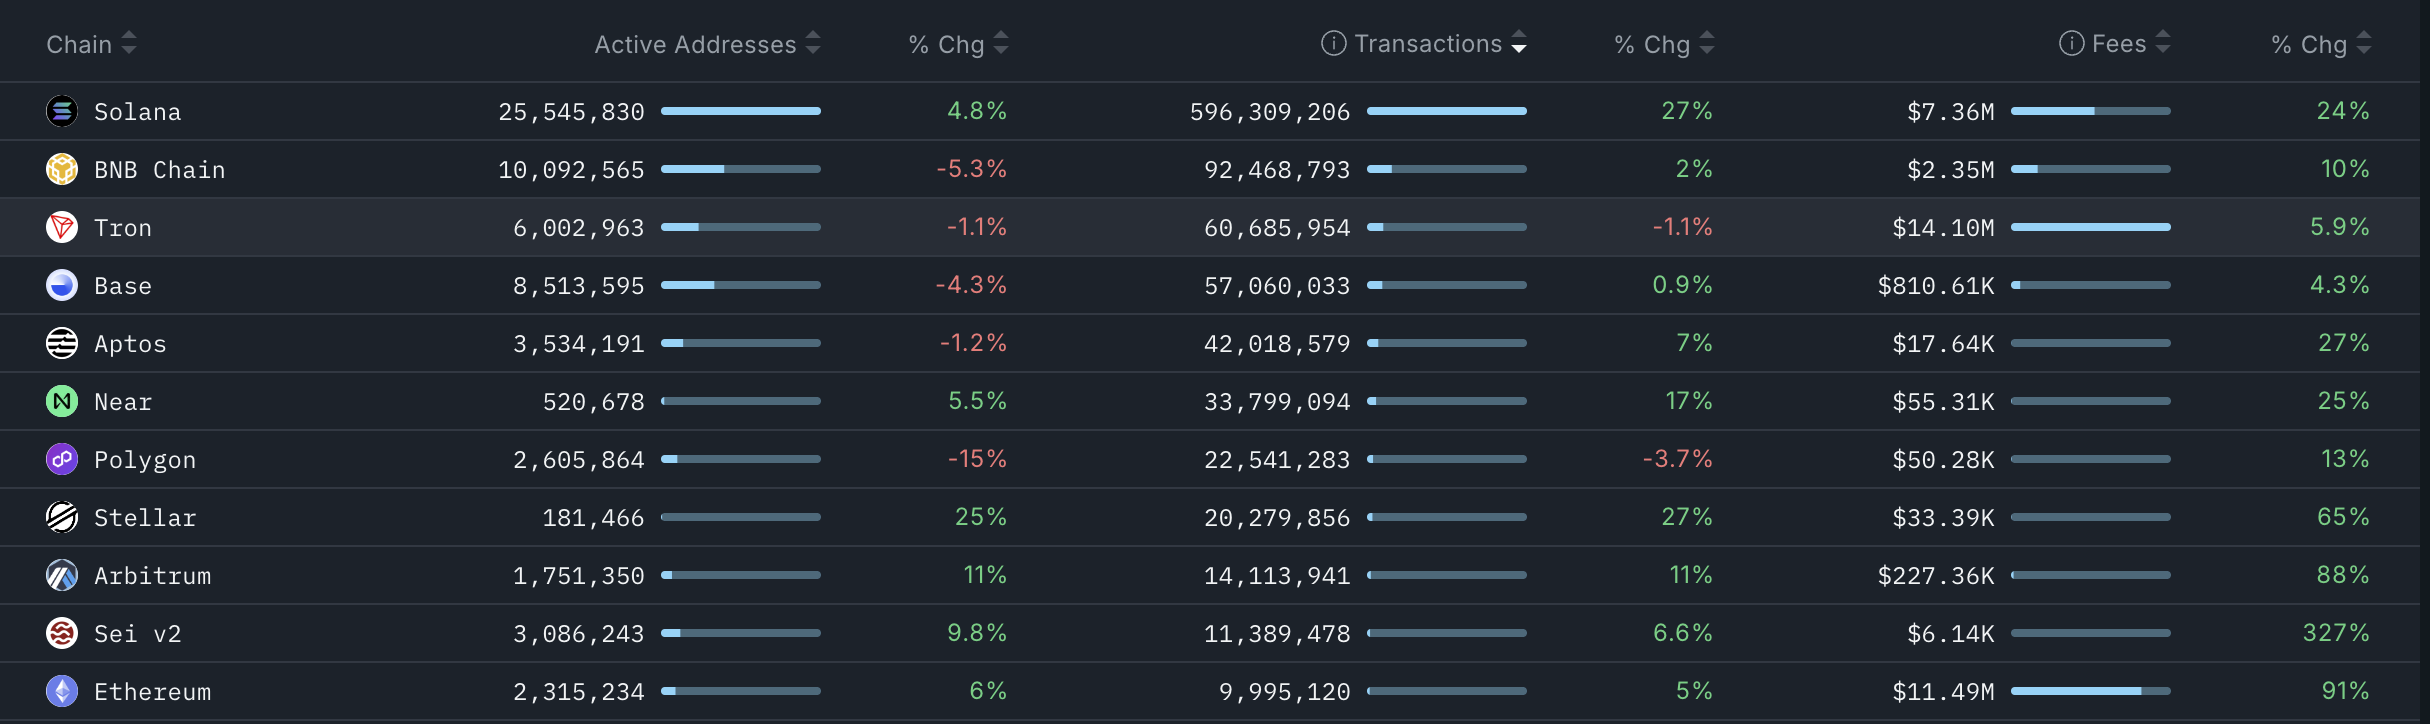
Additional metrics show continued strength in Solana’s network fundamentals. Data from Nansen reveals that transaction volume increased by 27% over the past seven days, exceeding 596 million total transactions, more than the other top ten chains combined.
Solana’s active addresses ROSE by nearly 5% to 25.5 million, while total network fees climbed 24% to $7.3 million. Rising network fees, address activity, and usage generally signal growing on-chain engagement.
Further data shows that Solana’s stablecoin network is thriving. Its stablecoin addresses have soared by 40% in the last 30 days to over 3.3 million, while its monthly transactions and adjusted volume rose to $194.3 million and $108 billion, respectively.
Solana is also seeing more demand as the REX-Osprey SOL + Staking ETF inflows have soared to over $77 million, a significant increase for a fund that was launched less than two weeks ago.
Further, investors are still increasing their staked solana positions. Its inflows in the last 30 days stood at 6 million tokens worth $913 million.
Solana price prediction
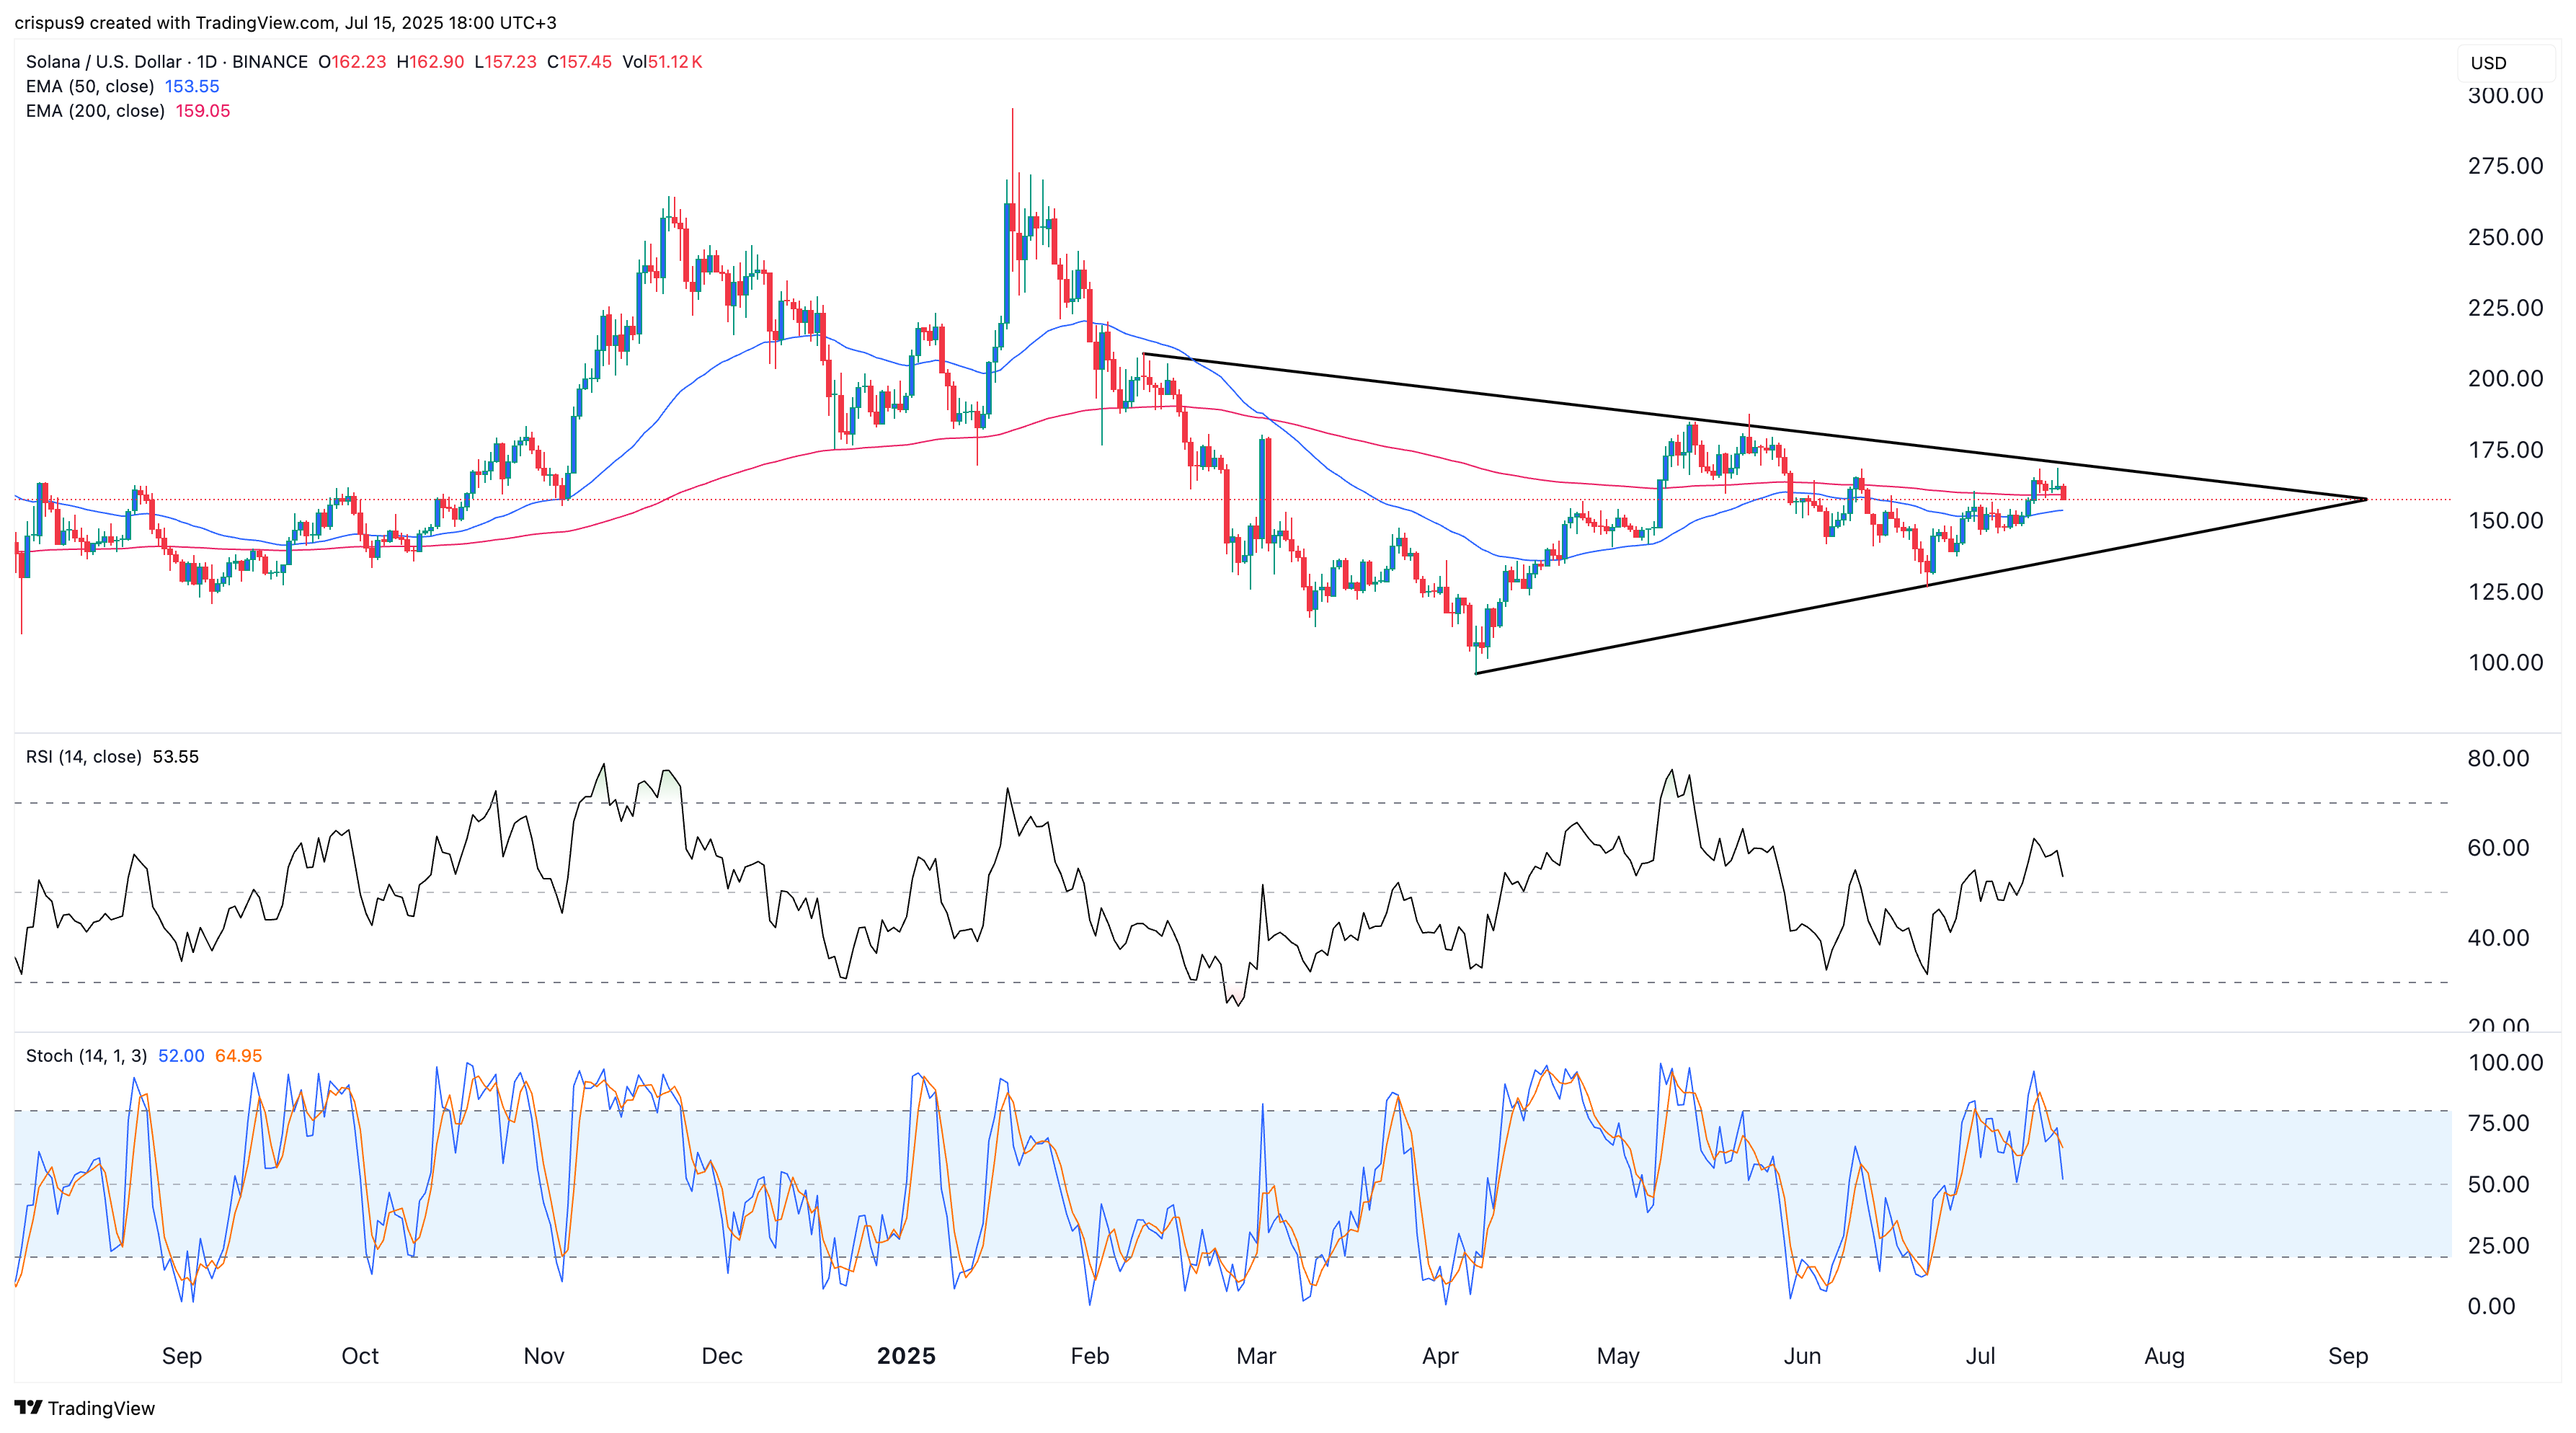
On the daily chart, SOL has traded sideways in recent days as bullish momentum slowed. Price action has formed a large symmetrical triangle, with the upper and lower trendlines converging.
SOL is consolidating NEAR its 50-day and 200-day Exponential Moving Averages. Meanwhile, the Relative Strength Index and Stochastic Oscillator are both trending lower, reflecting reduced short-term momentum.
Still, the symmetrical triangle pattern suggests that consolidation may lead to a breakout. A move above the triangle’s upper boundary WOULD likely confirm a bullish continuation, with $200 as the next technical target.
