HBAR Price Alert: Brace for a Sharp Correction as Mean Reversion Kicks In

HBAR's rally hits a wall—gravity always wins in crypto.
Technical indicators scream overbought as traders pile in late. The 'smart money' is already rotating—retail FOMO won't hold this up forever.
Mean reversion isn't a suggestion. It's a law. And HBAR's 300% pump since June? Textbook pullback fuel.
Watch the $0.32 level like a hawk. Break that, and the cascade could turn ugly fast. Pro tip: When your Uber driver starts shilling altcoins, it's time to hedge.
HBAR price technical analysis
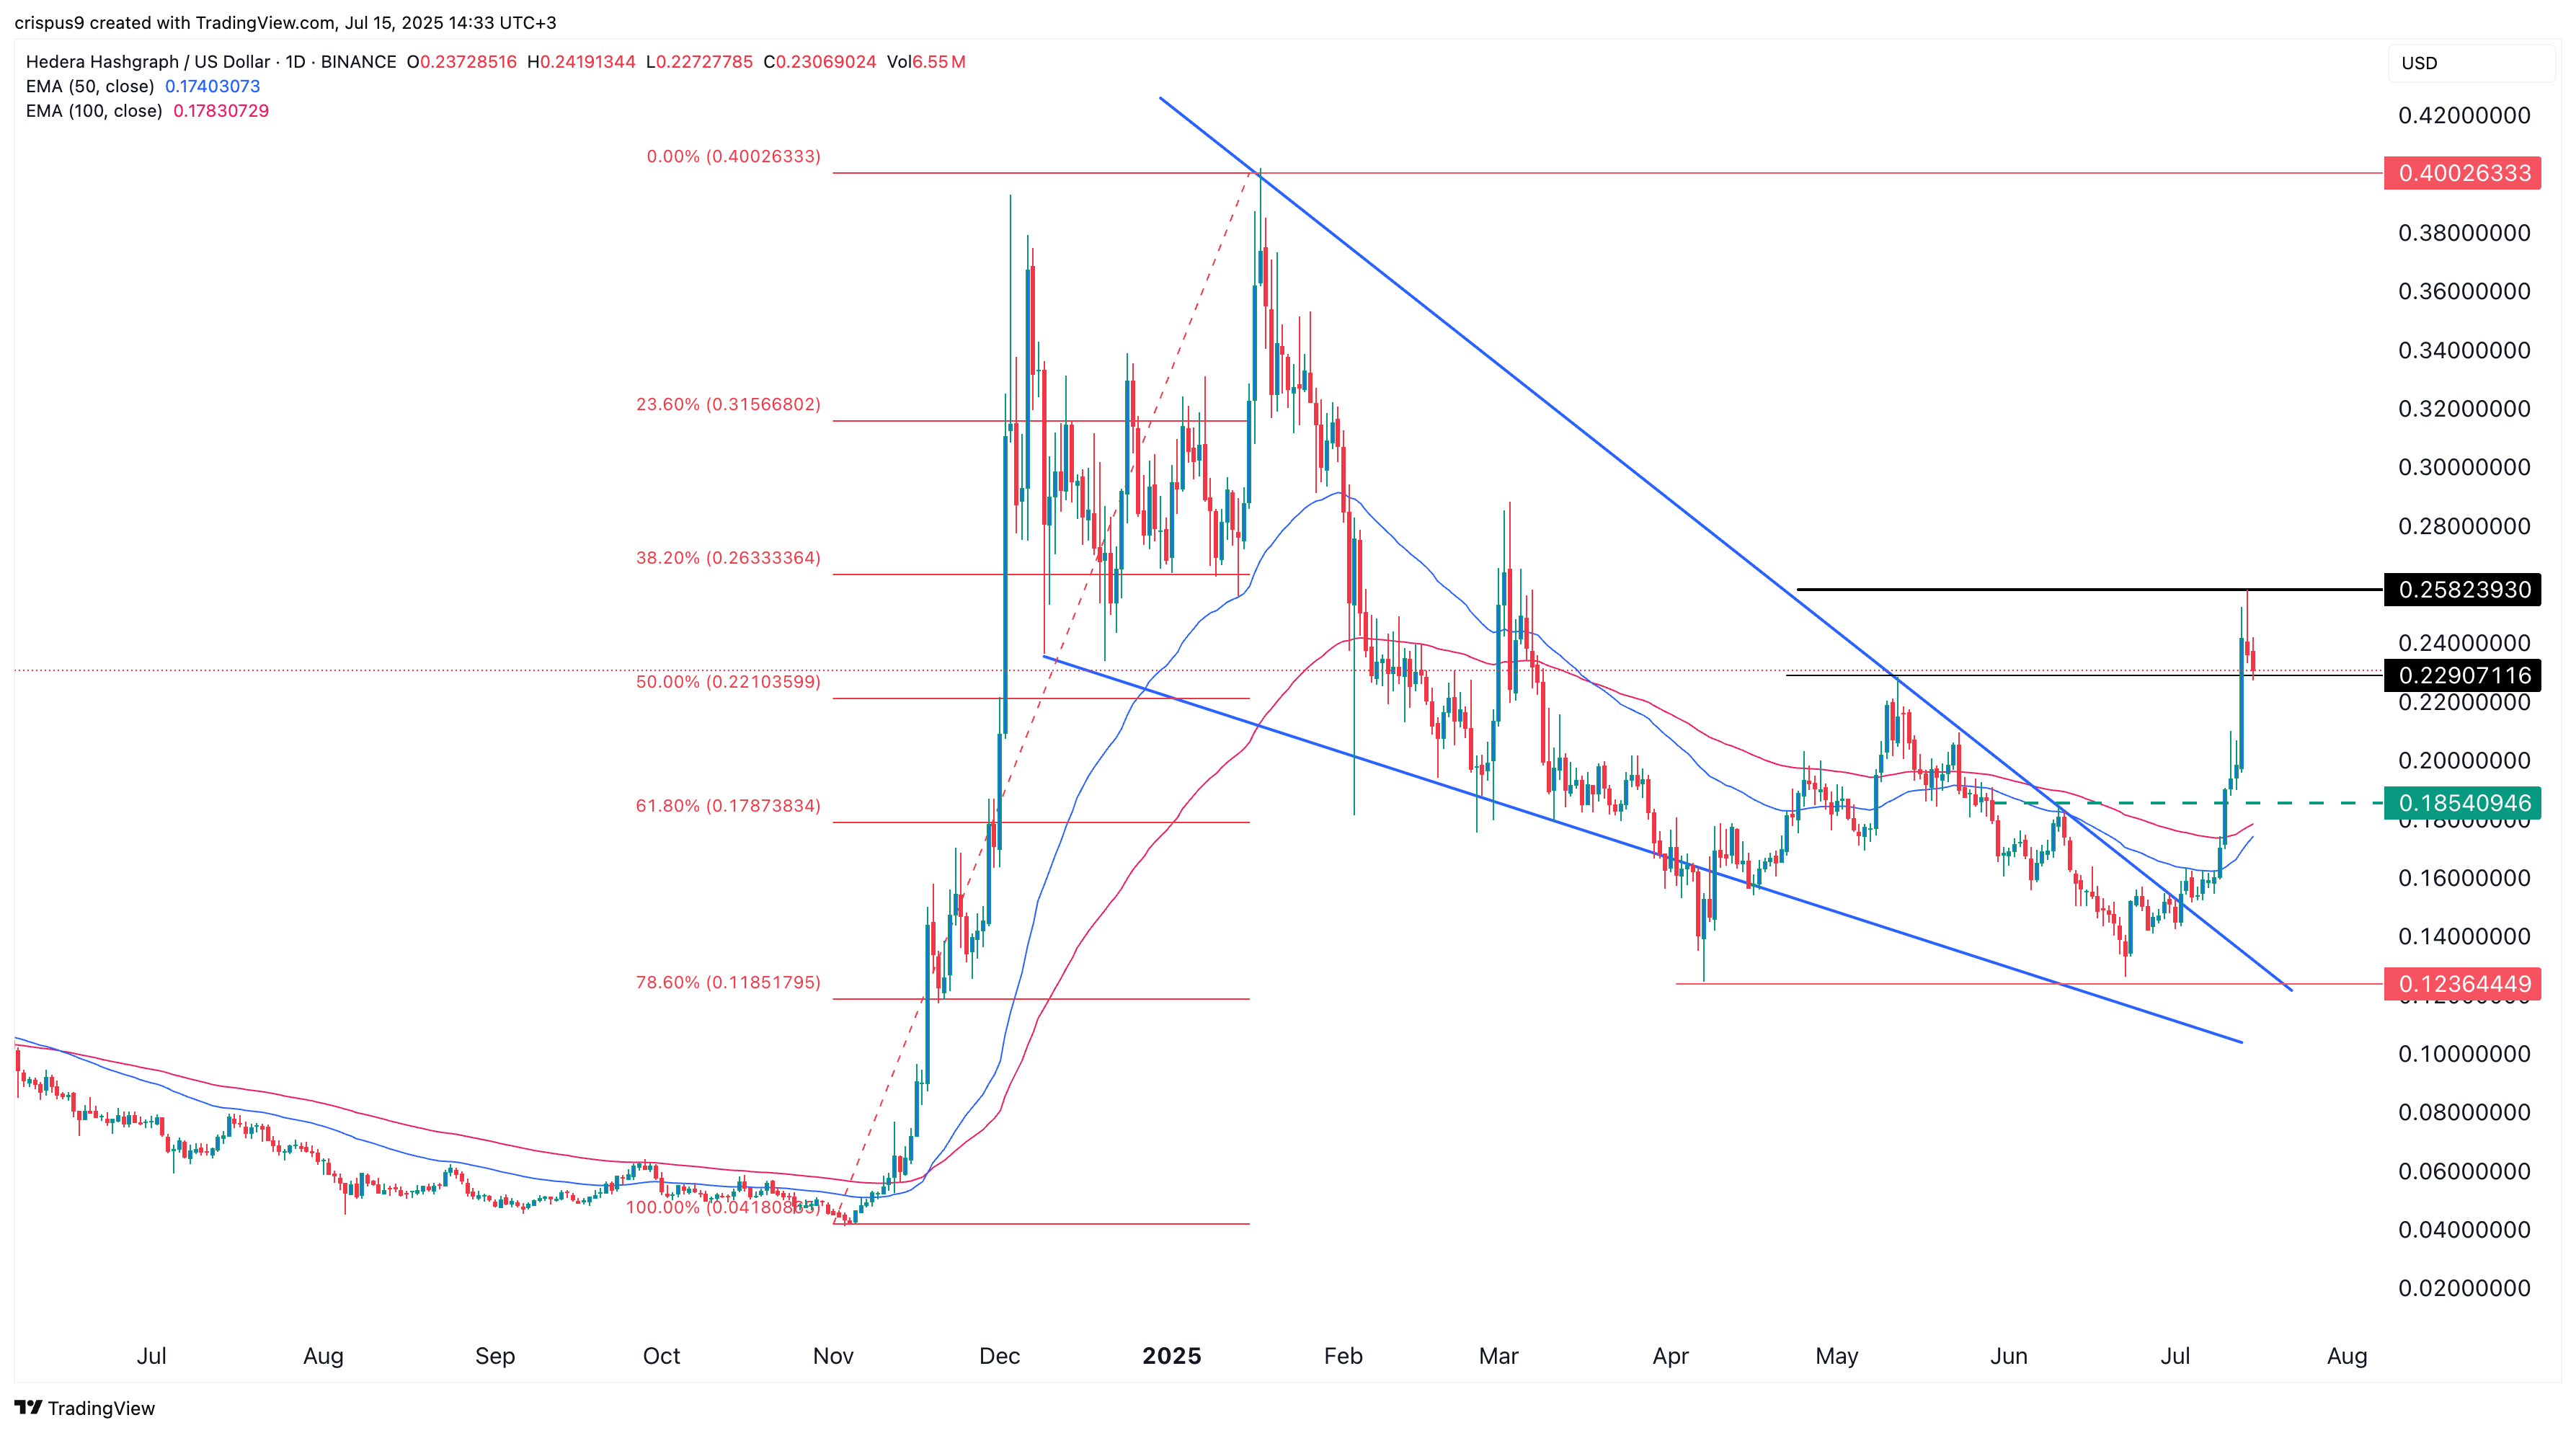
The daily chart above helps explain why Hedera’s price staged a strong comeback. The token formed a highly bullish falling wedge pattern, characterized by two descending and converging trendlines. The breakout occurred as the trendlines neared their point of confluence.
HBAR also formed a double-bottom pattern at $0.1236 with a neckline at $0.2290. A double bottom is considered a classic bullish reversal signal in technical analysis.
However, the risk is that HBAR’s price has deviated significantly from its 50-day and 100-day moving averages. It currently trades about 30% above these averages, indicating a potential mean reversion.
Mean reversion refers to the tendency of an asset to return to its historical averages. If this plays out, HBAR may decline from its current level of $0.2320 toward the 50-day moving average at $0.1740 before potentially resuming its upward trend.

Log in to Reply
Log in to comment your thoughtsComments
Related Articles
|Square
Get the BTCC app to start your crypto journey
Get started today Scan to join our 100M+ users