AVAX Primed for Breakout: Bullish Double Bottom Signals Major Reversal at Critical Support

AVAX isn't whispering—it's screaming a buy signal. The crypto just carved a textbook double bottom at a make-or-break support level, and traders are scrambling for position.
Technical Setup: The Double Bottom Playbook
Two distinct troughs formed at the same price floor—classic reversal pattern. Volume spiked on the second bounce, confirming buyers stepped in hard. Now, AVAX just needs to clear the neckline to confirm the uptrend.
Why This Matters More Than Usual
This isn't some random support zone. We're talking about the level that held during May's bloodbath—where institutional algos apparently decided 'enough is enough.' Break this, and even the perma-bulls might finally admit we're in a bear market (but let's be real—they'd just call it a 'accumulation phase').
Next Price Targets If Pattern Holds
Measure the distance from trough to neckline, project upward—that's your initial profit zone. After that? The 200-day MA becomes the next battleground. Of course, this all assumes Bitcoin doesn't do its usual trick of crashing right when altcoins start looking interesting.
Bottom line: The chart says buy. The macro says maybe. Your FOMO says 'just YOLO it already.'
Key technical points
- Double Bottom at Key Support: Pattern forming at a high time frame demand zone.
- POC Confluence: Support aligns with volume profile point of control.
- Upside Target: $41.80 — near the 0.618 Fibonacci and value area high.
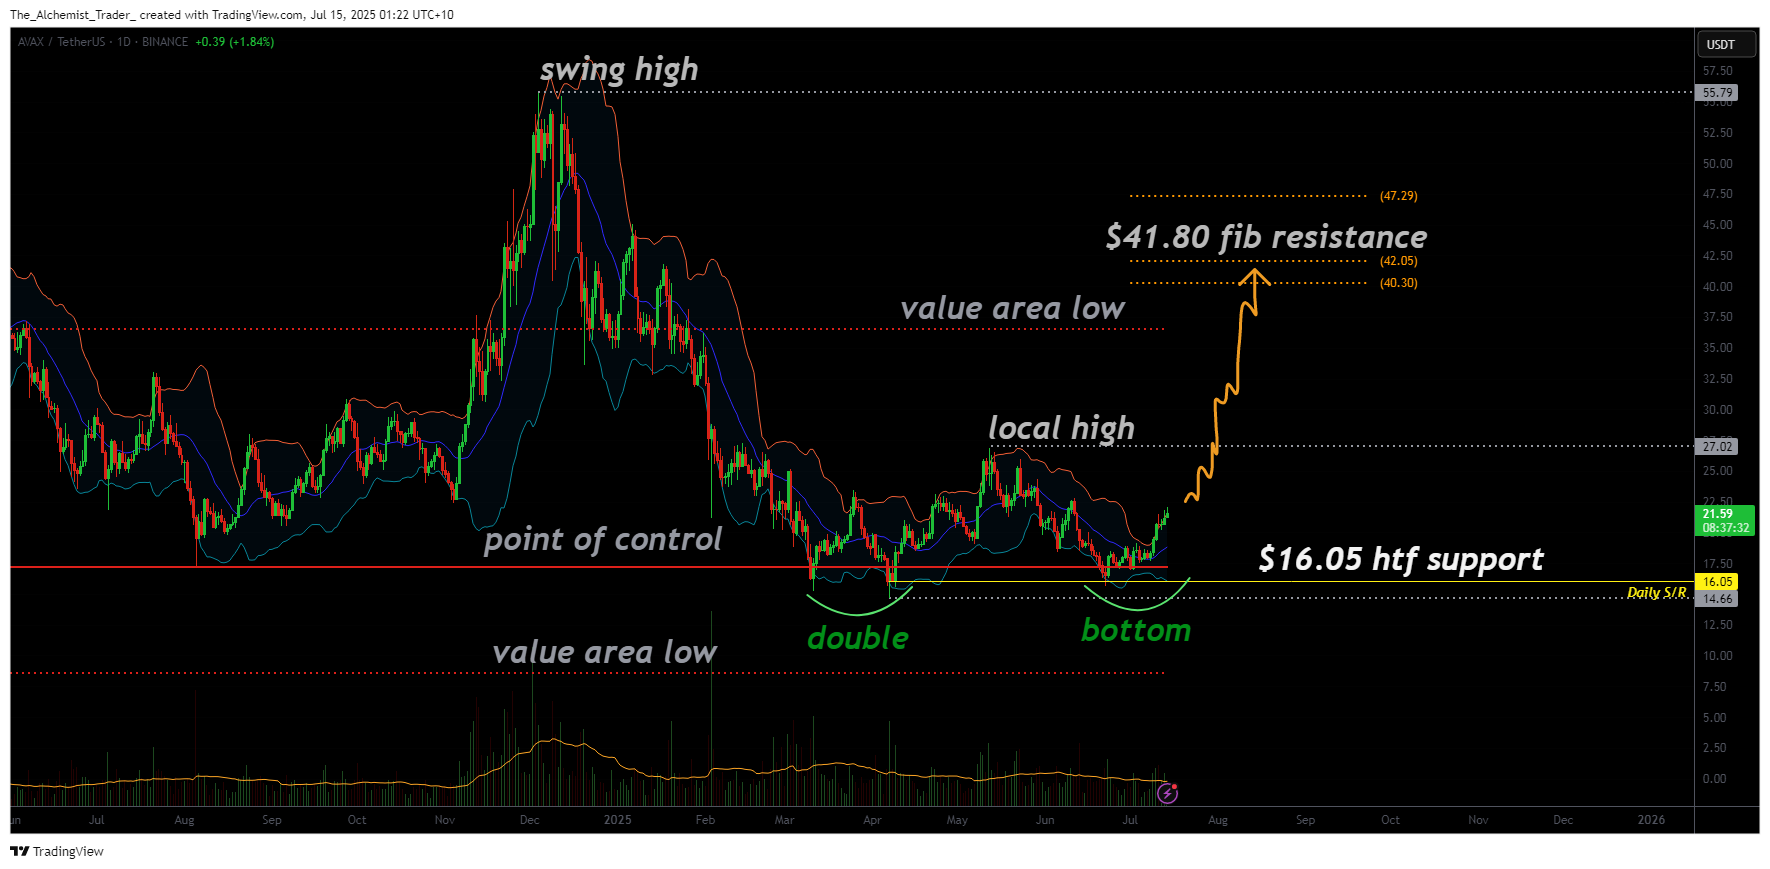
The double bottom pattern is beginning to take shape as AVAX holds above a well-established support region. This area also coincides with the point of control from the visible range volume profile, reinforcing its significance. A double bottom in this context represents a shift from prolonged selling pressure to potential accumulation.
The bullish reversal will be validated only once the local high, the neckline of the pattern, is taken out. Doing so WOULD not only activate the double bottom but also mark the first higher high, effectively transitioning AVAX into a bullish market structure on higher time frames.
A confirmed breakout would open the door for a rally toward the value area high, which coincides with the 0.618 Fibonacci retracement level. This places the next technical target at approximately $41.80. The price reaction at this resistance zone will be critical in determining whether AVAX continues into a longer-term uptrend.
Current volume remains subdued, which is typical in the early stages of reversal patterns. What’s crucial is a volume influx following the breakout above the local high. A sharp increase in buy-side volume would give legitimacy to the breakout and could accelerate the move toward $41.80 and beyond.
What to expect in the coming price action
If the double bottom holds and AVAX breaks above the local high with strong volume, the path toward $41.80 becomes highly probable. Traders should watch for a decisive move and confirmation via volume to validate the bullish breakout scenario.
