Ethereum’s Meteoric Rise: 4 Charts That Explain the Crypto Frenzy

Ethereum isn't just climbing—it's rewriting the rules. Here's what's fueling the rocket.
1. The Defi Domino Effect
Yield-hungry investors keep piling into Ethereum's decentralized playground. No surprise—Wall Street's 2% savings accounts can't compete.
2. Institutional FOMO Goes Mainstream
BlackRock's ETH ETF approval triggered a stampede. Suddenly every hedge fund manager 'always believed' in smart contracts.
3. The Gas Fee Paradox
Network activity spikes should cripple ETH with fees. Instead, layer-2 solutions turn congestion into proof of demand.
4. The Bitcoin Halving Ripple
BTC's supply squeeze sends altcoin hunters straight to ETH—the only crypto with both liquidity and actual utility.
Is this sustainable? Ask the 'experts' who called $500 the top in 2023.
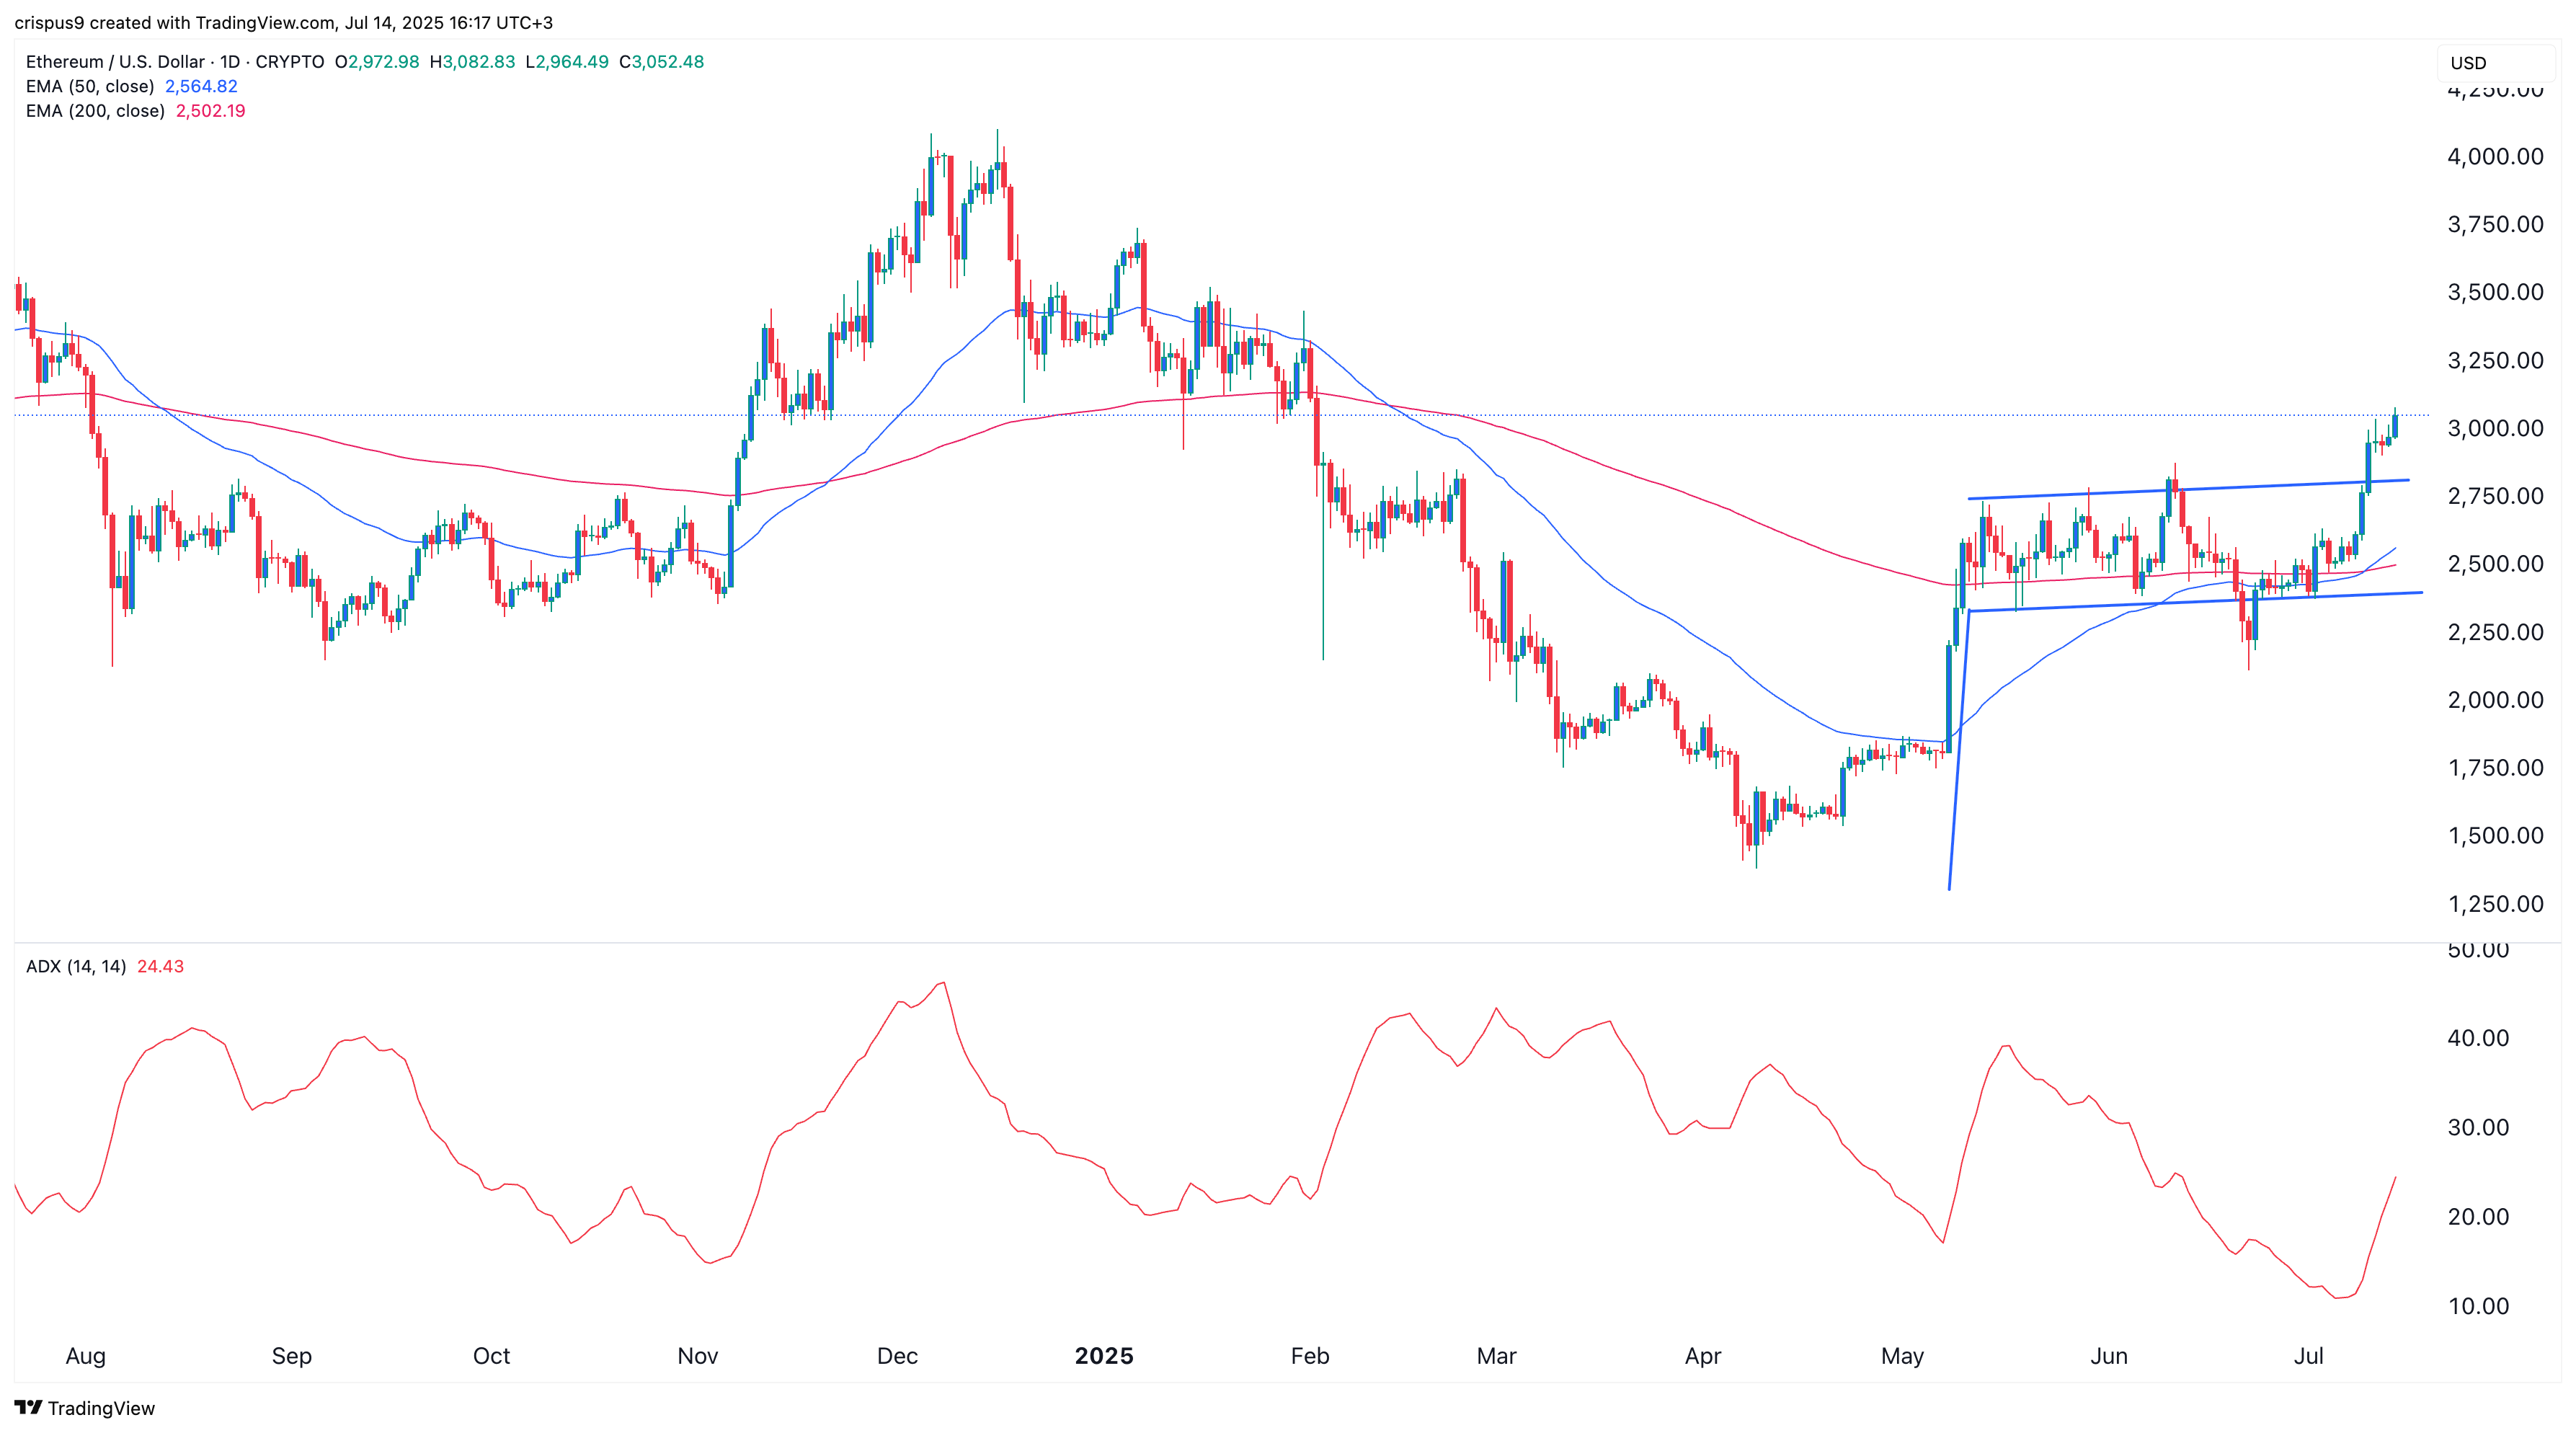
1. Ethereum price forms a golden cross pattern
The daily chart shows why ETH has rebounded strongly. The rally followed the formation of a bullish flag pattern, which includes a vertical pole and a rectangle-shaped consolidation. ETH has now broken above the upper boundary of the flag.
Ethereum has also formed a golden cross pattern, as the 50-day and 200-day Exponential Moving Averages crossed each other. A golden cross is widely considered a highly bullish technical signal.
The Average Directional Index has also rallied to 24, its highest level since June 7. An ADX reading above 20 typically indicates strong trend momentum. These signals point to a potential MOVE toward $4,000.
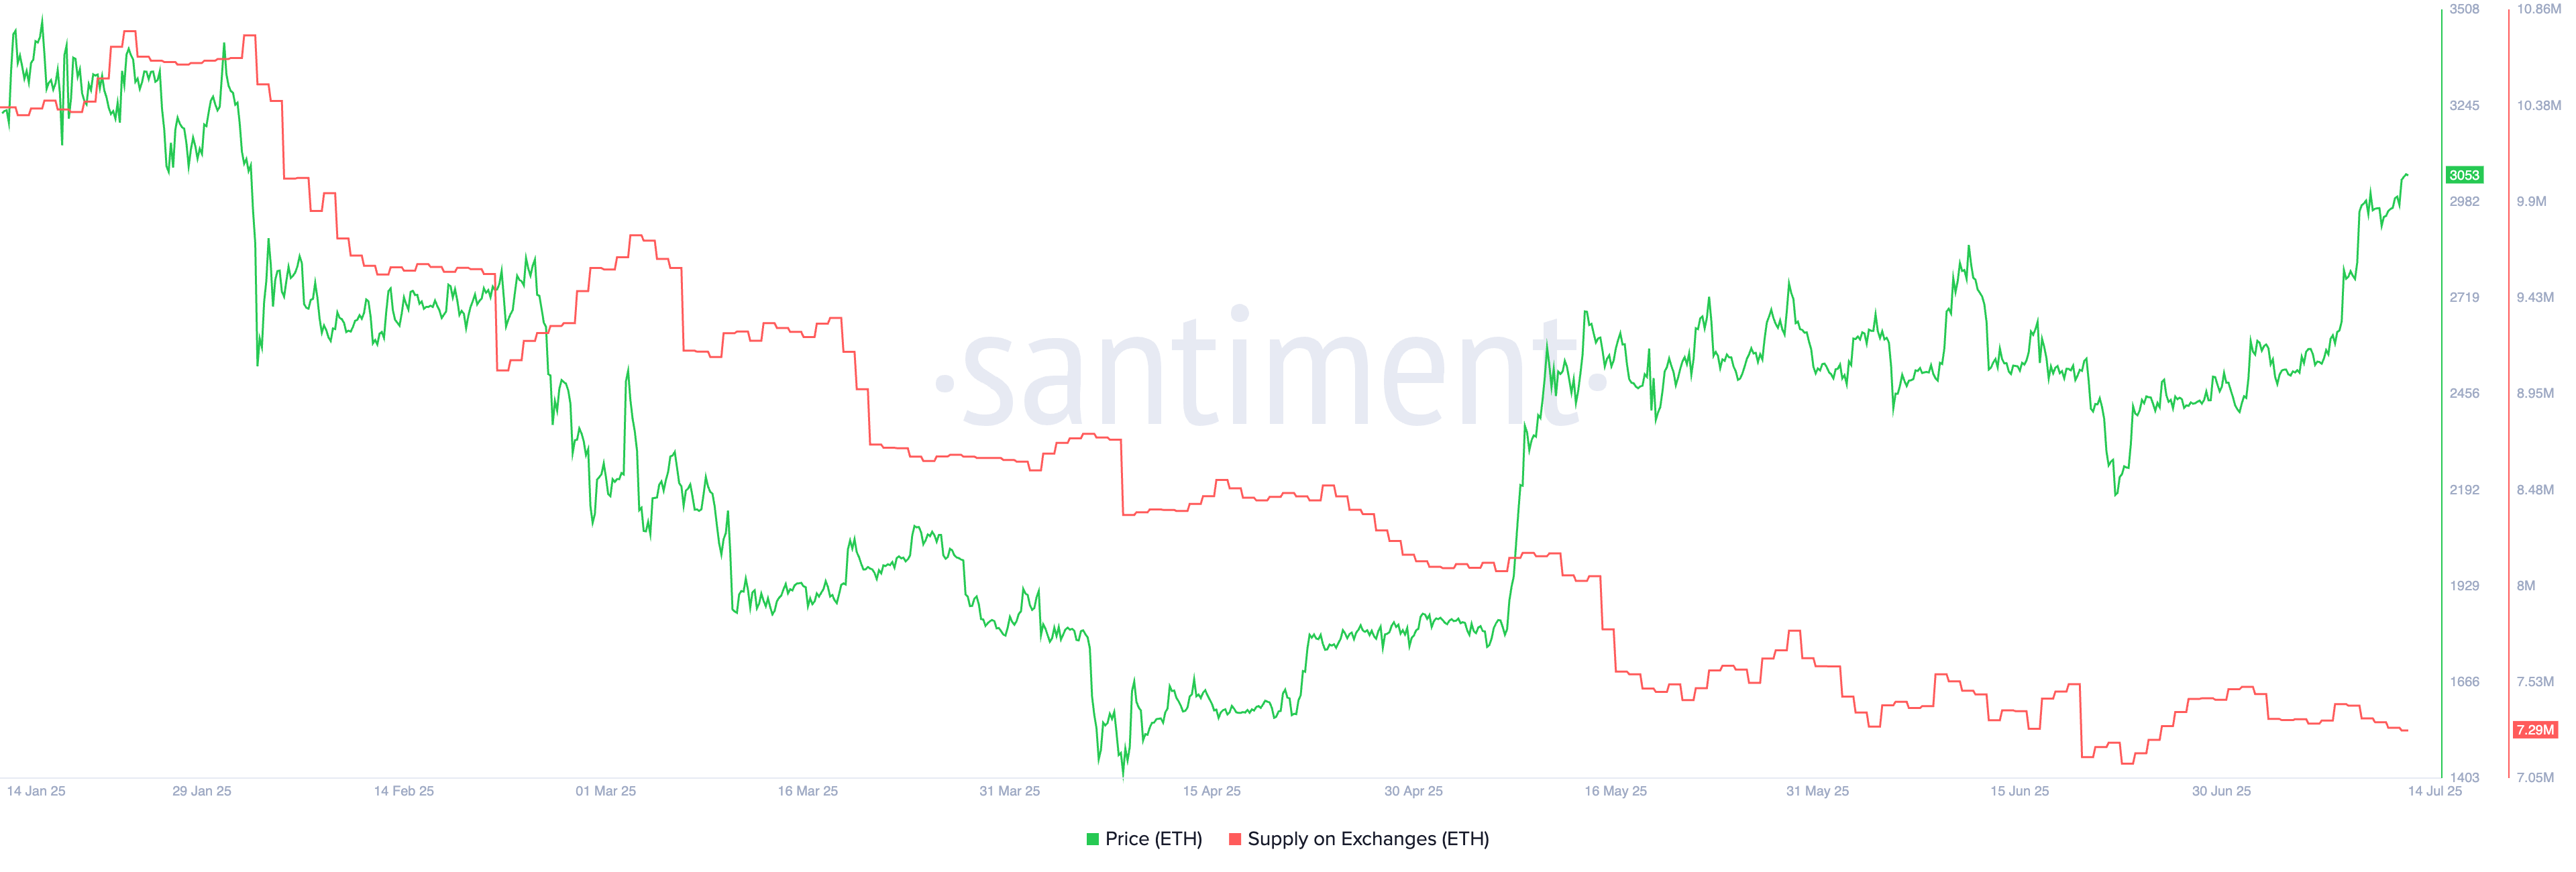
2. ETH supply on exchanges is falling
The chart below shows that Ethereum’s supply on exchanges has declined steadily this year. There are currently 7.29 million tokens on exchanges, down from a year-to-date high of 10.73 million.
Declining exchange balances suggest that investors are moving coins into self-custody. This behavior is often seen as bullish, signaling expectations of further price appreciation.
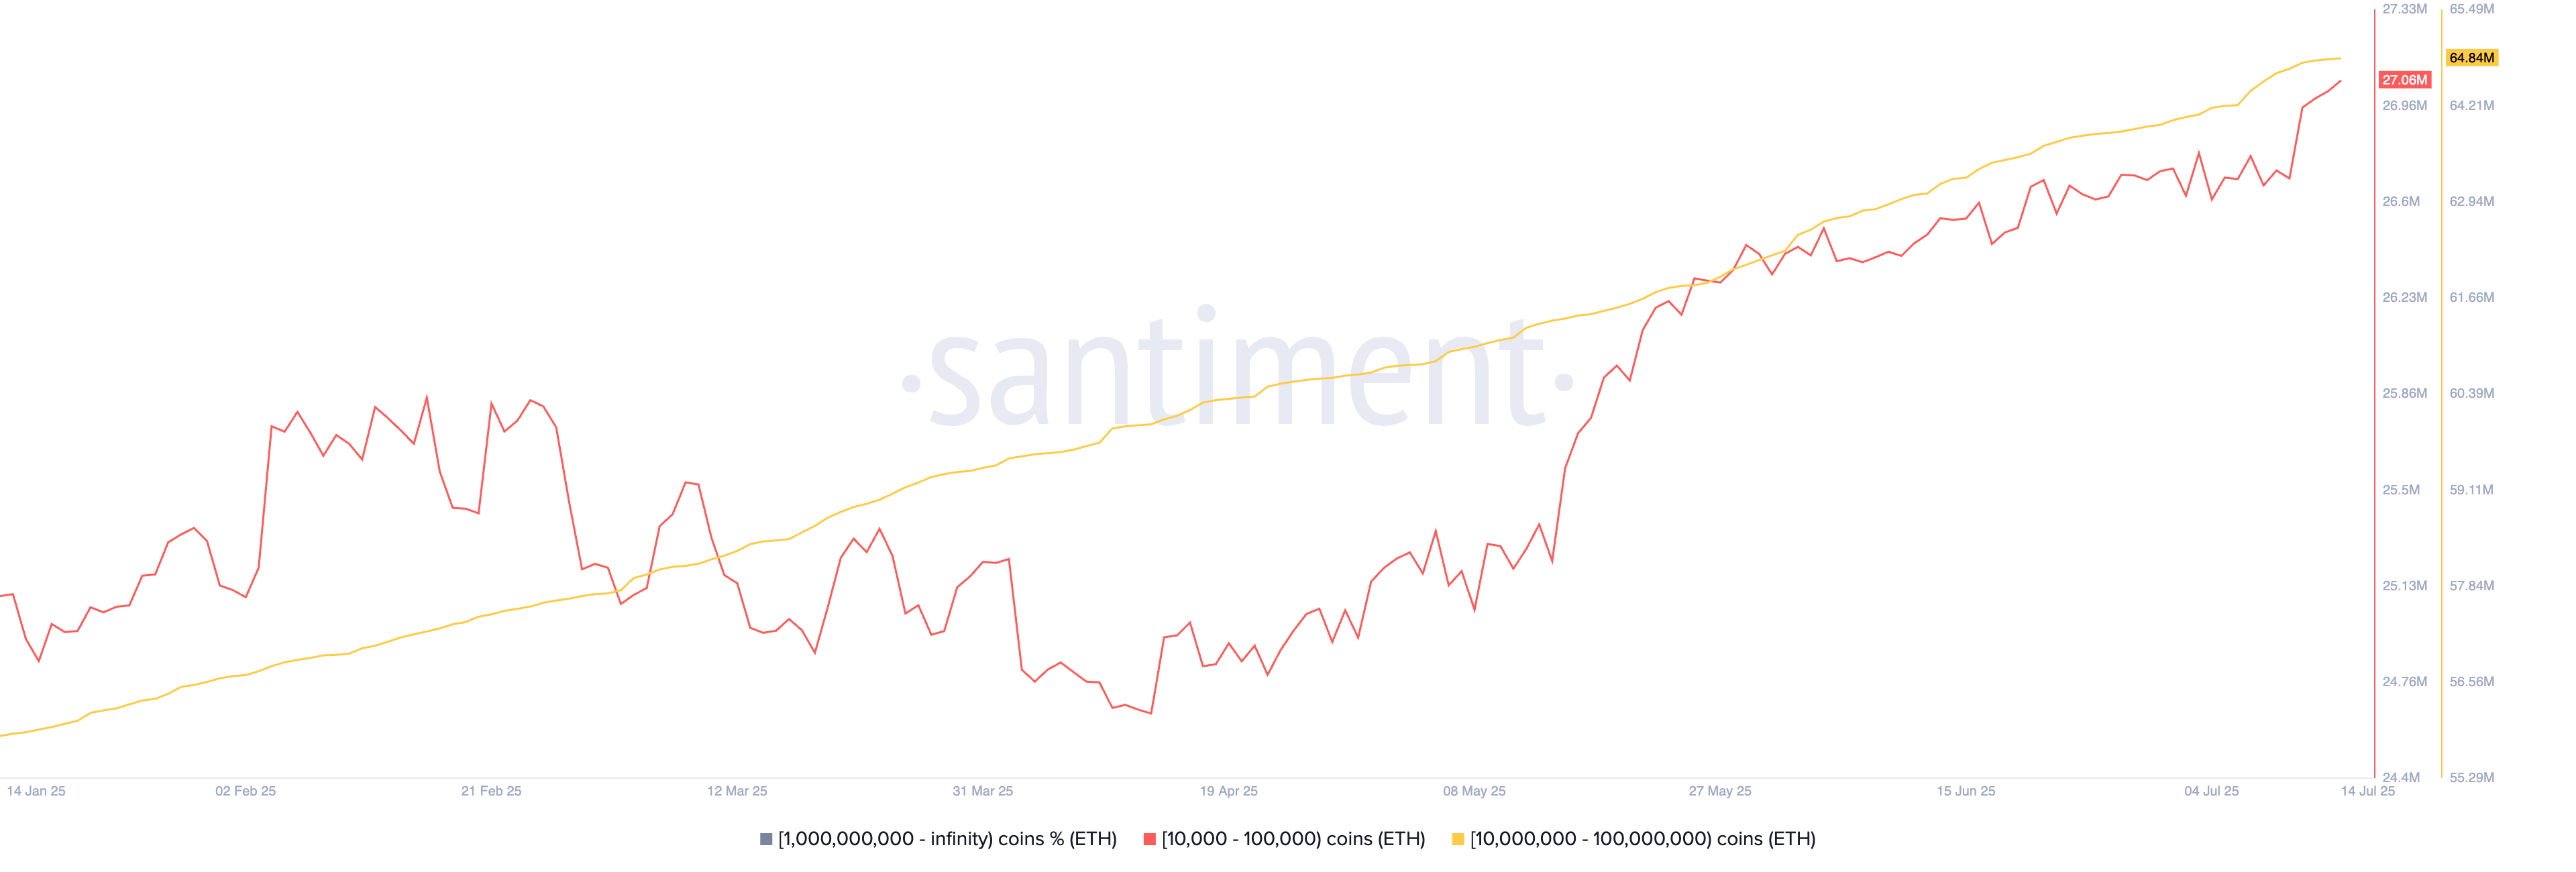
3. Ethereum whale accumulation
Meanwhile, the next chart shows that whales or large investors have continued buying Ethereum. Whales and smart money investors are widely seen as being more experienced investors.
Wallets holding between 10,000 and 100,000 ETH have continued to grow their positions this year. These addresses now hold 27 million coins, up from a March low of 24.65 million.
Similarly, wallets holding between 10 million and 100 million ETH now hold 64 million coins, up from 55.8 million in January. Ongoing whale accumulation is a bullish signal. Historically, major sell-offs tend to follow periods of whale distribution.
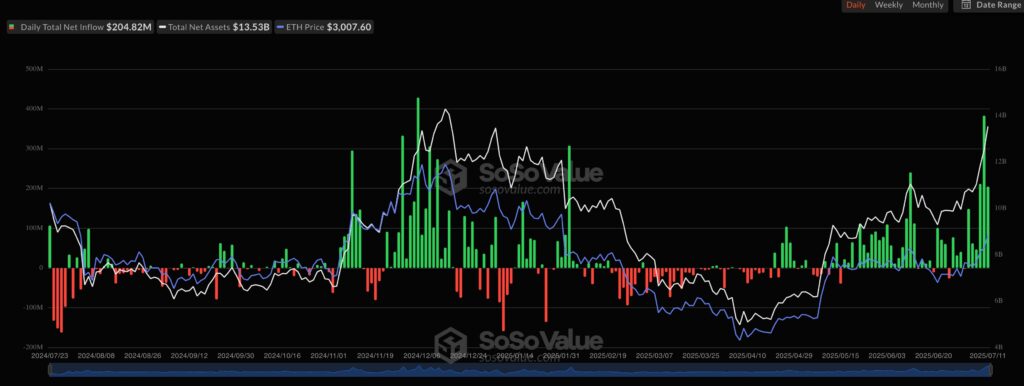
4. Ethereum ETF inflows
Wall Street investors have also ramped up ethereum accumulation through ETFs. These funds have recorded inflows for nine consecutive days, bringing cumulative assets to over $5.3 billion. Total ETH ETF holdings now stand at $13.5 billion, representing 3.7% of the current market cap.
Several additional data points support Ethereum’s ongoing rally. For instance, the stablecoin market cap has surged to a record high above $127 billion, while the total value locked (TVL) in DeFi protocols has spiked to over $160 billion.
Another notable metric: Ethereum open interest has soared to a record high of nearly $45 billion.
