🚀 Bitcoin Primed for $130K Surge: Bullish Breakout Looms as Market Structure Flips

Bitcoin's chart is screaming bullish—and Wall Street's latecomers are scrambling for seats.
The setup: A textbook ascending triangle has formed on BTC's weekly chart, with the $130,000 price target now in play. This isn't hopium—it's simple technicals. The last time these patterns appeared in 2020, Bitcoin rallied 300%.
Why now? Institutional inflows hit $1.2B last week while retail FOMO remains curiously absent. Even goldbugs are quietly rotating into BTC ETFs (though they'll never admit it).
The kicker: Miner reserves just hit a 3-year low—historically the precursor to violent upside. Combine that with the halving's supply shock, and you've got rocket fuel.
Of course, some hedge fund manager will inevitably call it a bubble... right before deploying his third 'digital asset' fund. $130K or bust.
Key technical points
- Channel High Resistance at $130,000: Previous pivot zone where prior rallies were capped.
- Current Structure Remains Bullish: Price trading above channel mid-range support.
- Next Move Hinges on Reaction: $130,000 is a key inflection point for trend continuation or correction.
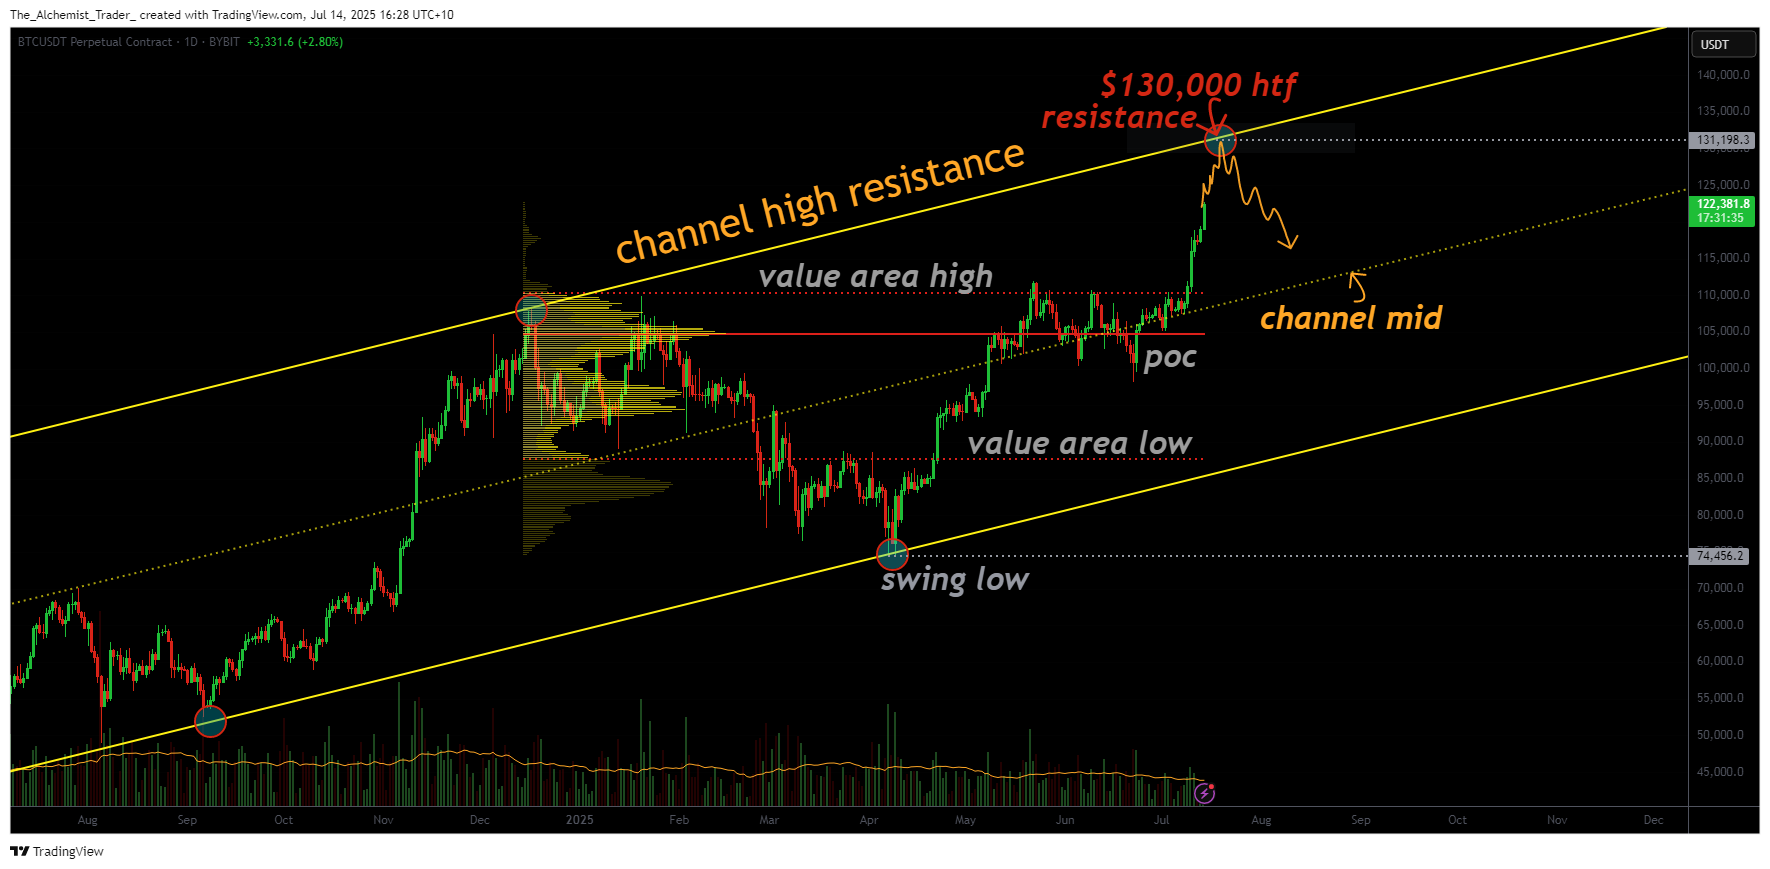
On the high time frame, Bitcoin continues to respect the boundaries of a well-defined ascending channel. The previous channel low acted as support during earlier pullbacks, while the channel high, currently around $130,000, has historically served as strong resistance. Price is now trading above the mid-range support of this channel, indicating momentum is still with the bulls.
From a technical standpoint, the structure remains decisively bullish. The consolidation above the mid-range and continuation of higher highs and higher lows suggest the market is gearing up for a retest of the channel high resistance. If bitcoin reaches $130,000, this would align with the upper boundary of the macro channel, a zone where sellers have previously stepped in and triggered downside rotations.
If a rejection occurs at this level, it WOULD likely lead to a healthy corrective move, giving swing traders an opportunity to position at lower levels while preserving the broader bullish trend. Such a correction would not be inherently bearish, but rather a reset of momentum. Until this happens, however, the market remains on course for continued upside toward the $130K level.
Should BTC break above $130,000 with conviction and volume, this would represent a major structural breakout, potentially opening the door to a new all-time high and further price discovery. The reaction at this zone will be critical in determining whether the trend accelerates or pauses.
What to expect in the coming price action:
Bitcoin is targeting $130,000 as the next key resistance. Traders should watch how price reacts at this level — a breakout could extend the rally, while a rejection may offer a swing trade setup.
