Algorand Primed for Explosive Rally as Double Bottom Pattern Emerges Amid Surging Network Activity

Algorand's chart just flashed a classic bullish signal—and this time, the network metrics back it up.
The Technical Setup
A textbook double bottom formed on ALGO's daily chart, typically signaling exhaustion of sellers and potential trend reversal. The pattern's neckline now acts as a springboard for upside.
Network Activity Goes Parabolic
Daily transactions and active addresses spiked 40% this week—real usage that could fuel the breakout. Developers keep shipping too, with three major DeFi upgrades hitting mainnet last Thursday.
The Elephant in the Room
Let's be honest: half the crypto market's 'fundamentals' are vaporware wrapped in buzzwords. But when on-chain data and technicals align like this? Even the most cynical traders pay attention.
Watch for a close above $0.85 to confirm the breakout. Below $0.68 invalidates the setup—and probably triggers another round of 'we're focusing on adoption' tweets from the team.
Algorand price technical analysis
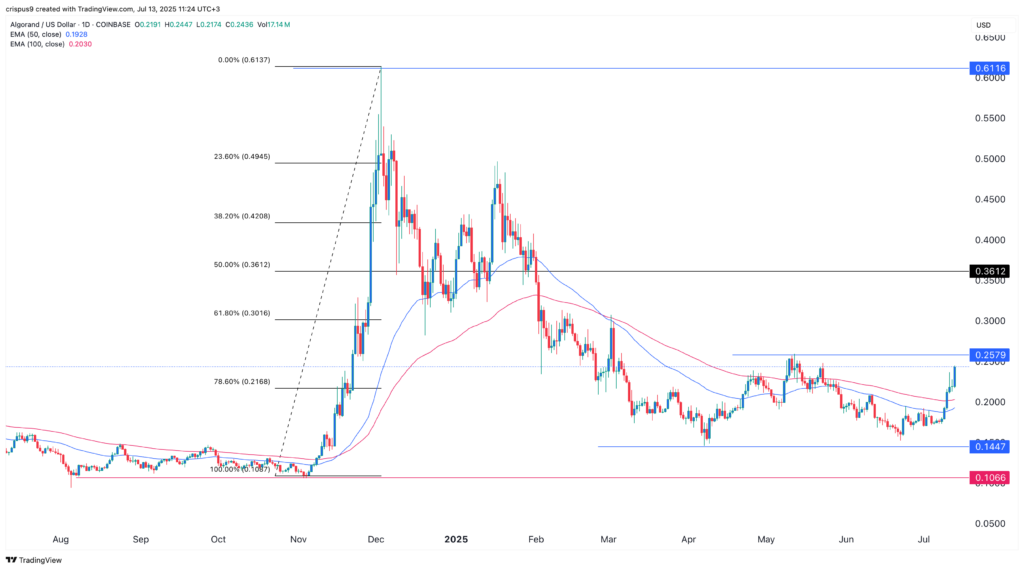
The daily chart shows that the ALGO price dropped to $0.1447 in June and formed a double-bottom pattern with a neckline at $0.2580. A double bottom is one of the most common bullish reversal signs.
The token has moved above the 78.6% Fibonacci Retracement level at $0.2168. It has also jumped above the 50-day and 100-day Exponential Moving Averages.
The Relative Strength Index and the MACD indicators have all pointed upwards. Therefore, the Algorand price is likely to continue rising as bulls target the key resistance level at $0.2580. A move above that resistance will point to more gains to the 50% retracement level at $0.3612.
