Stellar’s XLM Price Goes Parabolic: Here’s What’s Fueling the Rally

Stellar’s XLM is skyrocketing—and the market’s scrambling to keep up. Here’s why this underdog’s suddenly stealing the spotlight.
Network Upgrades Hit the Gas
Recent protocol enhancements slashed transaction times, putting XLM ahead of slower rivals. No more waiting around—just seamless cross-border transfers.
Institutional Money Wakes Up
Big players finally noticed Stellar’s real-world utility. Payments corridors? Check. CBDC integrations? Double-check. Suddenly every hedge fund’s ‘long-term believer.’
The Retail Frenzy Kicks In
Social media’s flooded with moon-shot predictions. Because nothing screams ‘sound investment’ like TikTok traders chasing 100x gains.
XLM’s surge isn’t just hype—it’s a perfect storm of tech and timing. But remember: what goes parabolic usually comes down harder. Ask your 2021 NFT portfolio.
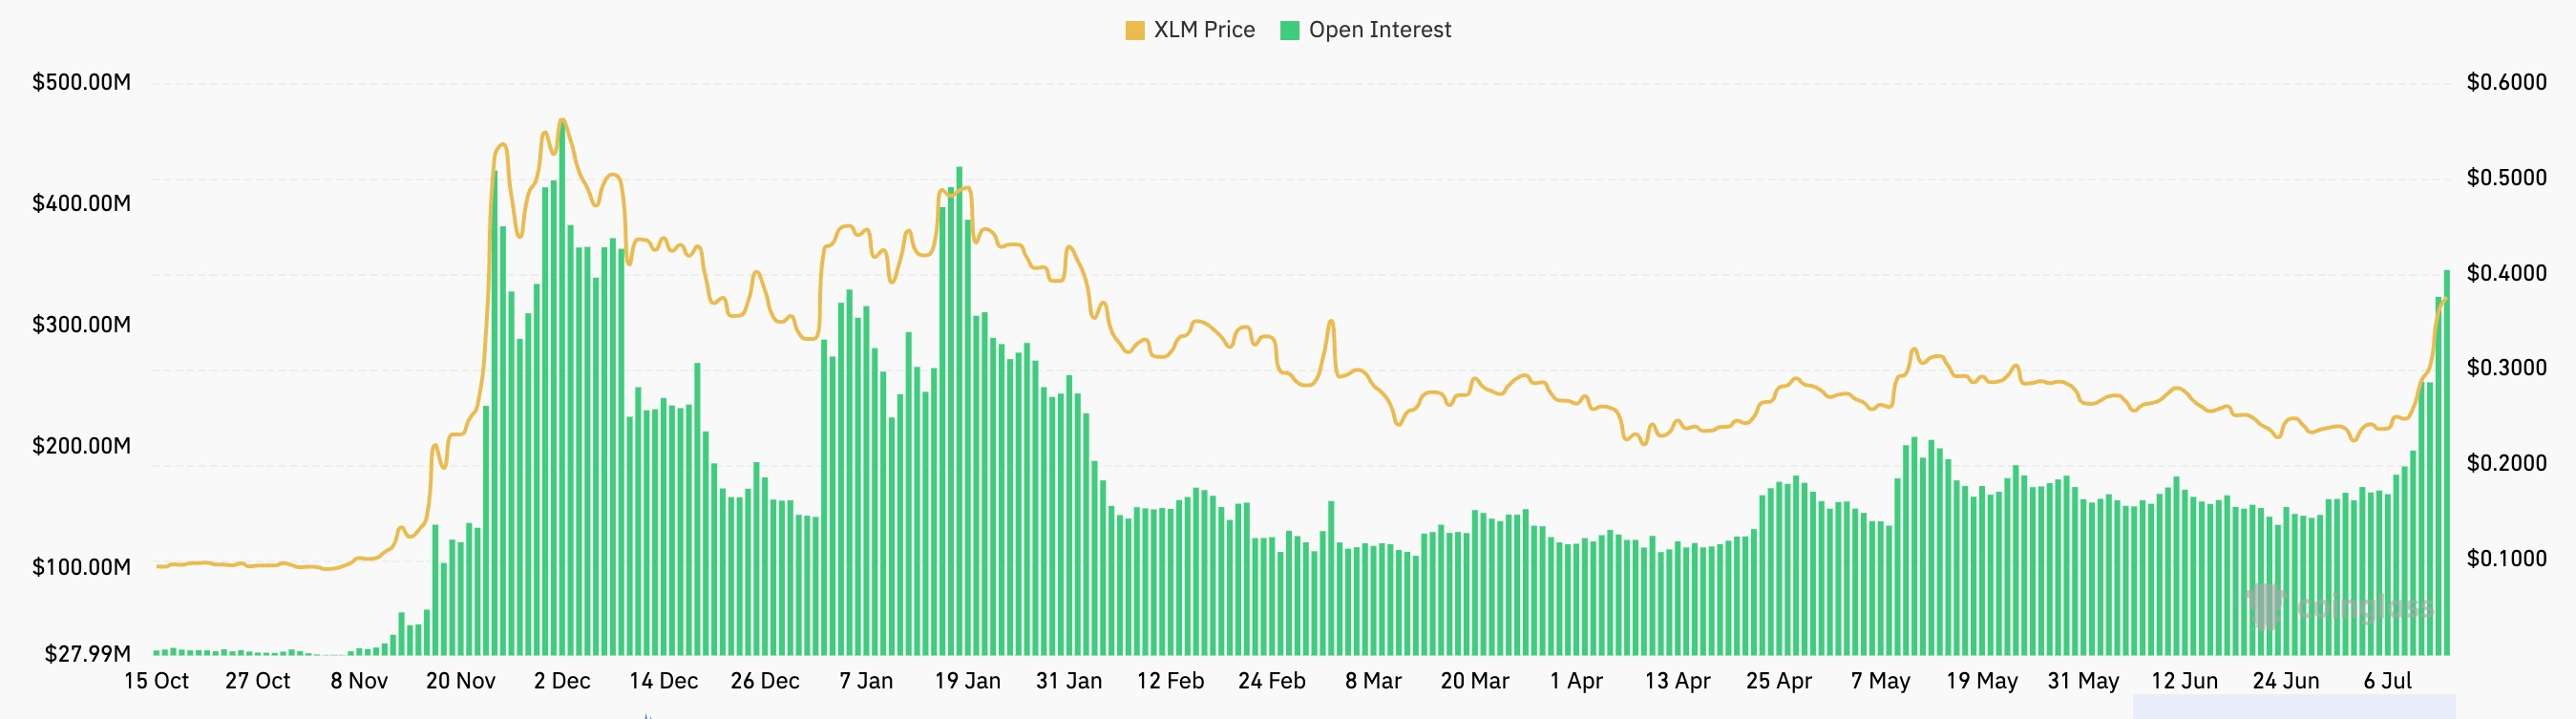 XLM open interest | Source: CoinGlass
Stellar Lumens token also jumped after DeFi Llama, a popular platform, updated its ecosystem stablecoins. Its data shows that the stablecoin supply in its network jumped to a record high of $627 million, up from the year-to-date low of $44 million.
However, the change was because the platform included the Franklin Onchain US Government Money Fund, which has over $446 million in its calculation. Excluding these assets, stellar has $181 million in stablecoin supply, most of which are USD Coins.
XLM price also rose as the number of active addresses, transactions, and fees jumped.
Data compiled by Nansen shows that Stellar’s active addresses jumped by 13% in the last seven days to 158,329, while transactions rose by 16% to 18.5 million.
XLM price technical analysis
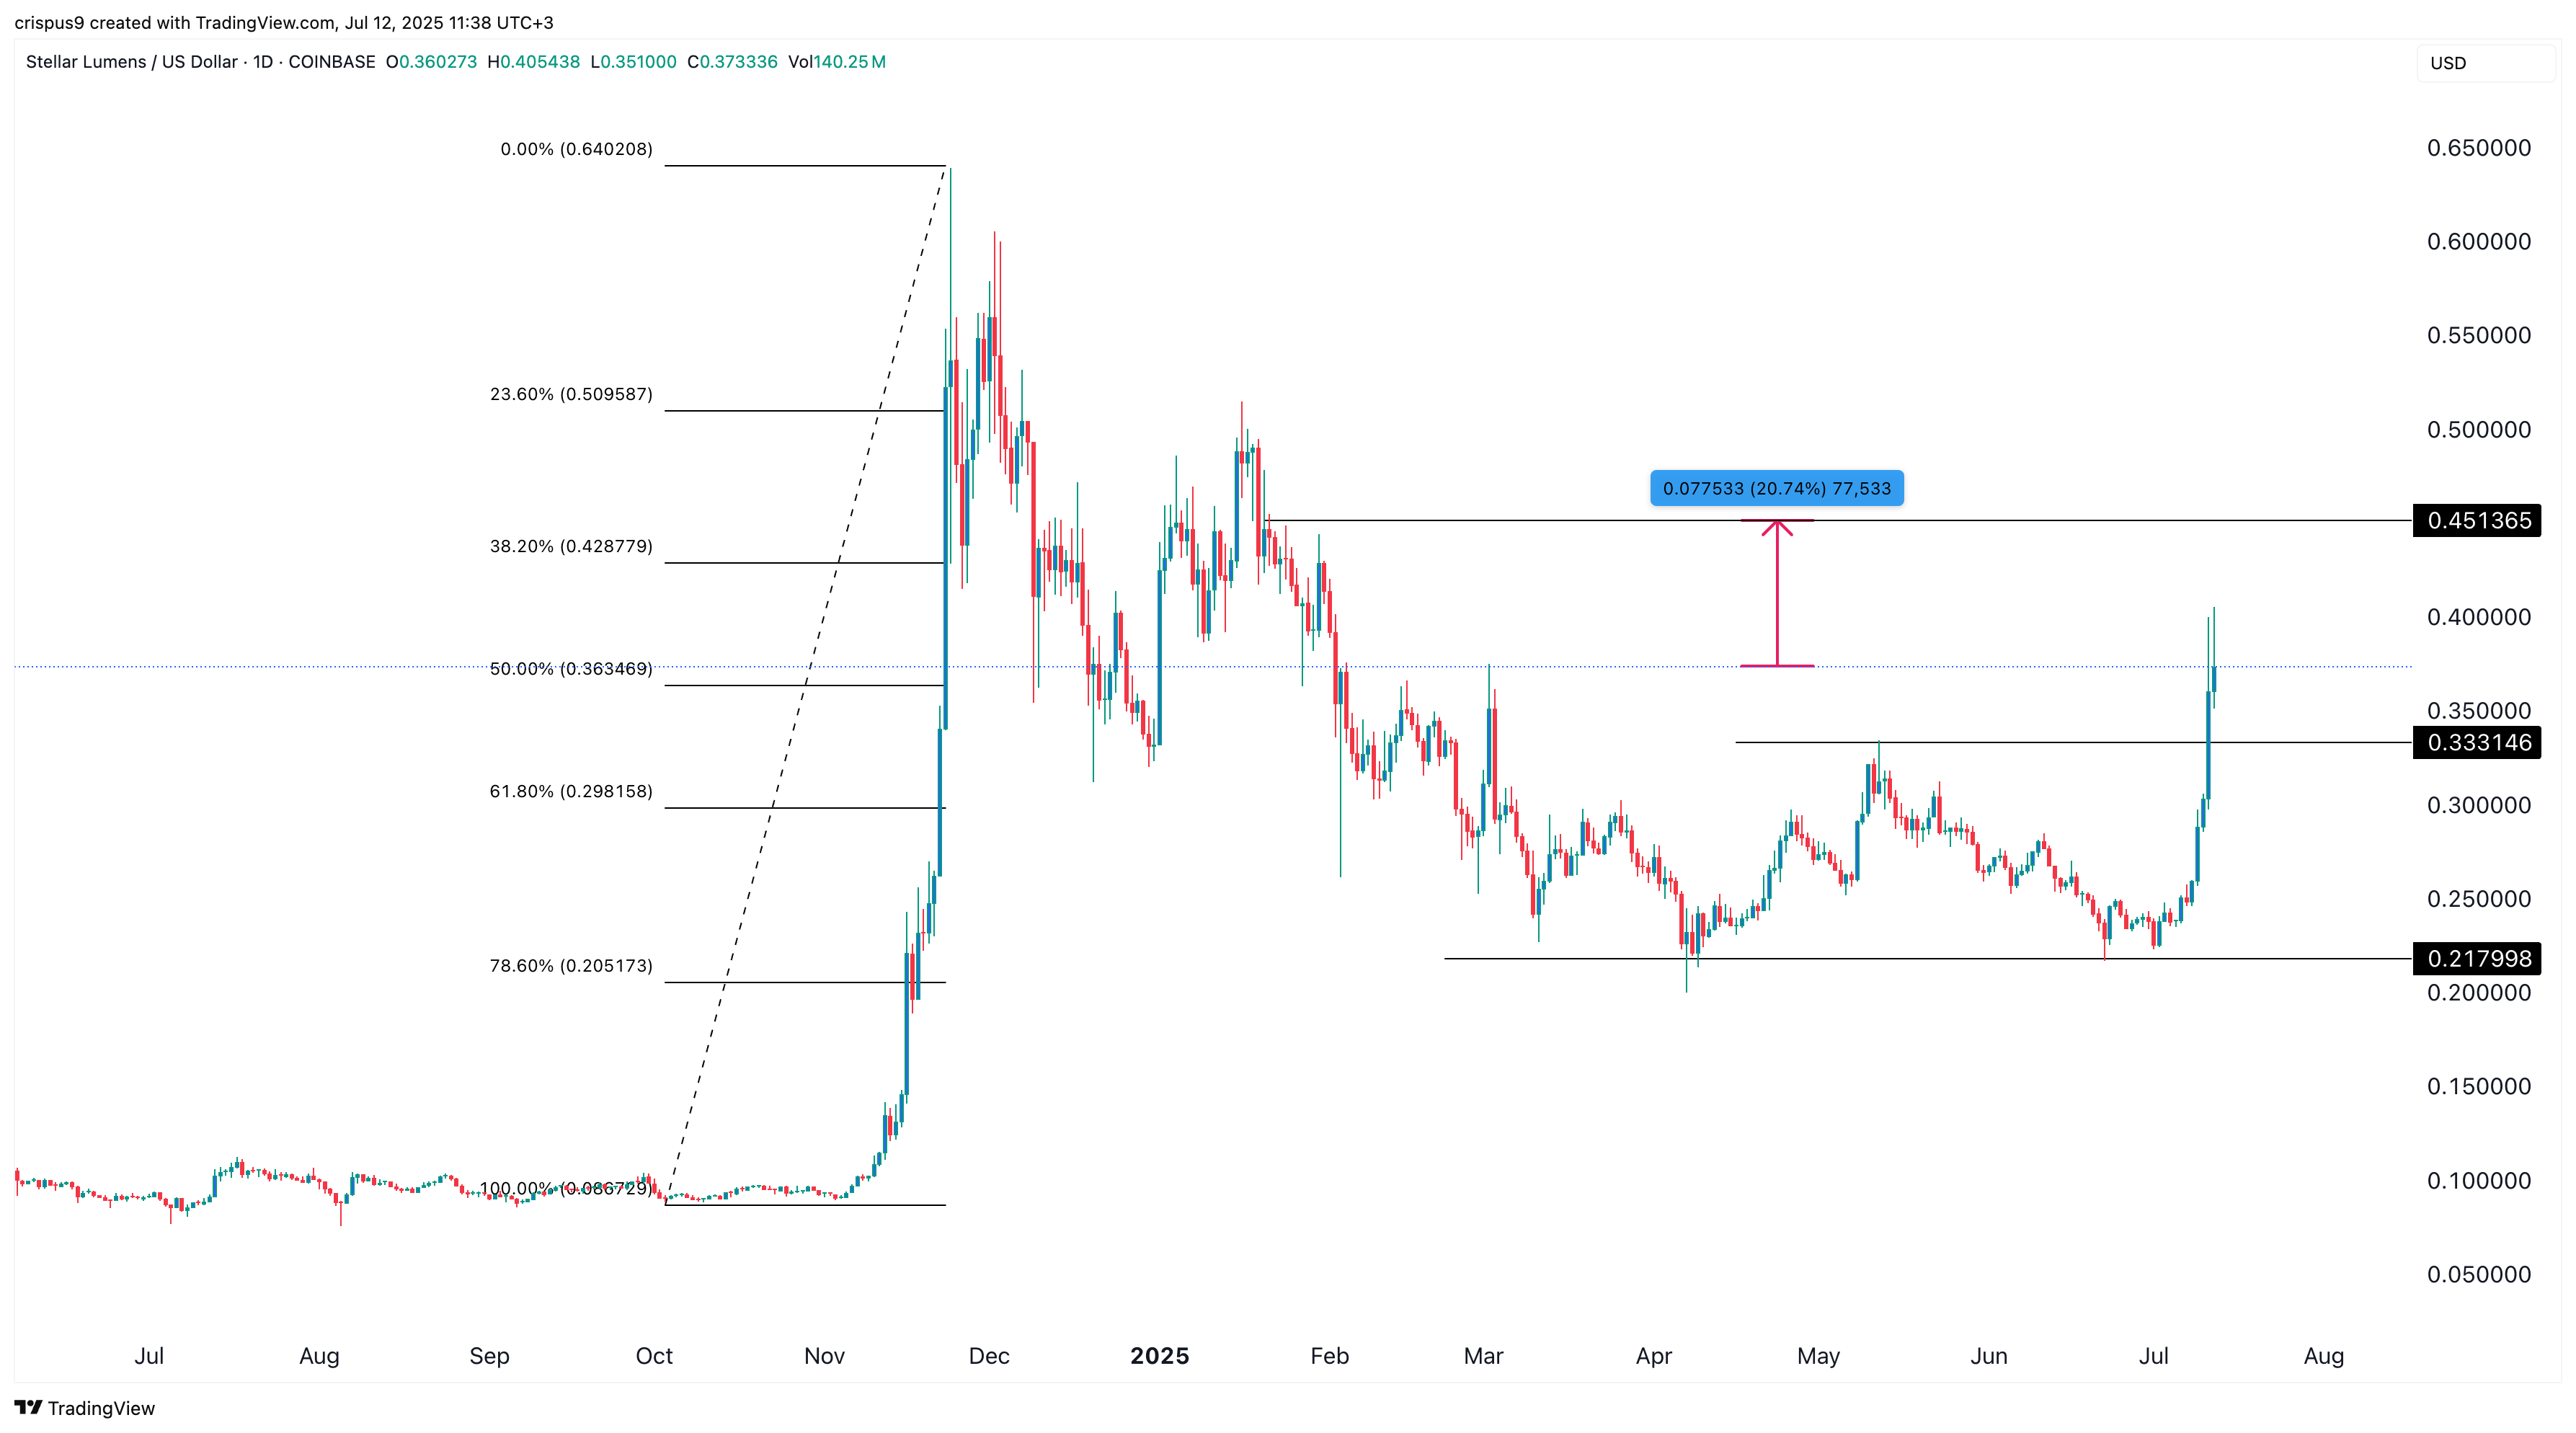
The daily chart shows that the XLM price jumped after forming a highly bullish pattern, known as a double bottom, as we wrote about hereIts lower side was at $0.2180, while the neckline was at $0.3331. This gave it a depth of $0.115.
In a double-bottom pattern, the price target is established by adding the height to the neckline. This sets a target of $0.45, which is approximately 20% above the current level. This price target is a few points above the 38.2% Fibonacci Retracement level.
Another potential scenario is where Stellar’s price drops and retests the neckline at $0.3331 and then resumes the uptrend.
