XRP Soars to 7-Week Peak Above $2.39 Amid Whale Frenzy — Where’s the Price Headed Next?

Whales are circling, and XRP just breached a critical resistance level. The digital asset surged past $2.39—its highest in seven weeks—as accumulation by deep-pocketed investors spiked. Is this the start of a parabolic rally, or another setup for the classic crypto rug pull?
Market watchers are split. The bullish case? Whale activity often precedes major price moves. The bearish take? Wall Street’s ‘buy the rumor, sell the news’ playbook loves crushing retail dreams.
Technical indicators flash mixed signals. RSI teeters near overbought territory, while trading volume suggests genuine momentum. Meanwhile, the SEC’s lingering glare at Ripple hasn’t scared off big money—yet.
One thing’s certain: Traders are gambling on whether this is the breakout or the bull trap. Just remember: In crypto, even the ‘smart money’ sometimes ends up as fish food.
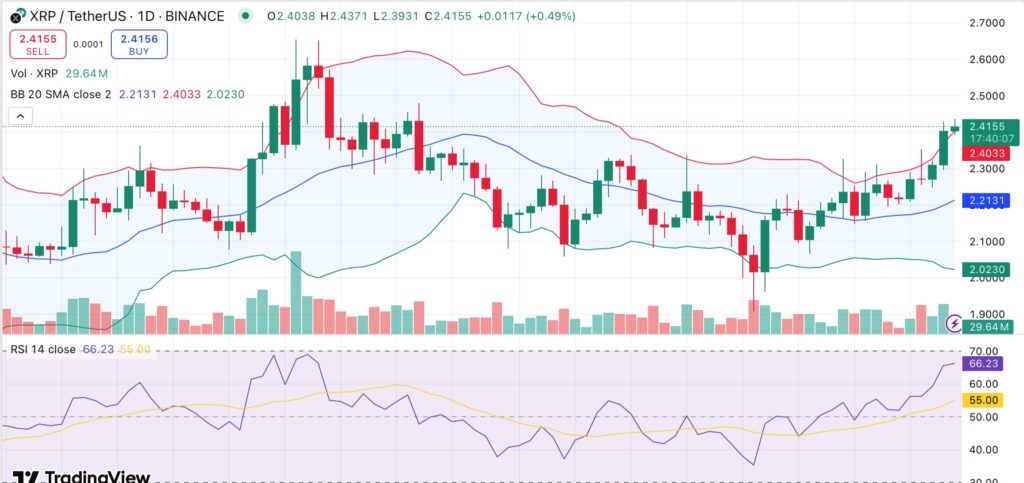 XRP price analysis. Credit: crypto.news
The relative strength index, at 66, shows significant momentum without yet reaching overbought territory. The MACD is still expanding and in positive territory, which is a sign of trend continuation rather than reversal. Volume has increased in tandem with the rally, supporting the validity of the breakout.
The Bollinger Bands width has widened, indicating increased volatility, often seen during the early stages of larger price moves. Nevertheless, since short-term oscillators such as the stochastic RSI are nearing their peak levels, it is impossible to rule out the possibility of a brief cooldown.
The next area to watch WOULD be close to $2.50, followed by the May highs around $2.63, if bulls can keep XRP above the $2.40 breakout level. This scenario is supported by steady accumulation from large holders and increasing trading volume.
But if the price falls back below $2.30, it could be a sign of a failed breakout and signal a drop toward the 20-day moving average, which is NEAR $2.21. This would probably raise doubts about the overall trend, particularly if volume begins to taper off.

Log in to Reply
Log in to comment your thoughtsComments
Related Articles
|Square
Get the BTCC app to start your crypto journey
Get started today Scan to join our 100M+ users