Uniswap Price Alert: Rare Chart Pattern Emerges as Whales Go on Buying Spree

Uniswap's price action just flashed a rare technical signal—and crypto whales are piling in. Here's why traders are watching this DeFi blue chip like hawks.
The Whale Factor: Big Money Bets on UNI
When crypto's deep-pocketed players start accumulating, markets take notice. The last time this pattern appeared, UNI rallied 80% in three weeks. But this isn't your typical 'buy the dip' scenario.
Technical Tightrope: Bullish Pattern Meets Macro Risks
That textbook inverse head-and-shoulders forming on the daily chart? Textbook bullish—if it holds. Meanwhile, traditional finance guys are still trying to explain how a DEX token has a $5B market cap while their beloved ETFs bleed out.
One thing's certain: In DeFi, when the whales move, retail follows. Whether that ends in celebration or carnage depends entirely on whether this pattern confirms... or becomes another 'false breakout' gravestone in crypto's volatile history.
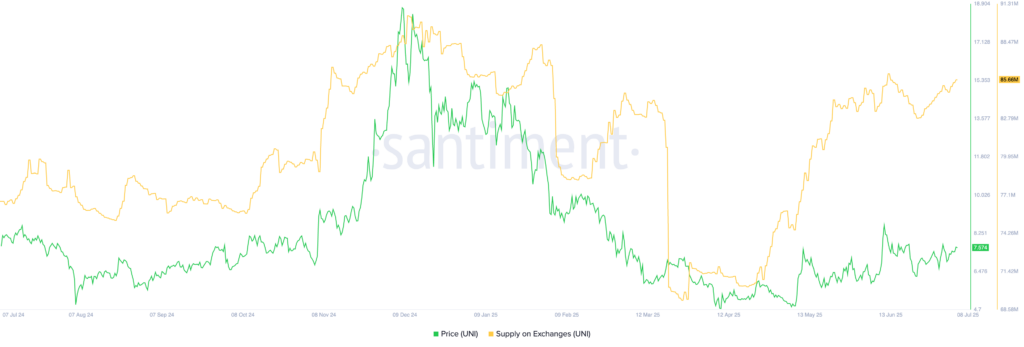 UNI exchange holdings | Source: Santiment
On the positive side, Unichain, the layer-2 network launched in March, continues to gain traction. Its protocols handled over $366 million in transactions in the past 24 hours, contributing to a 30-day volume of $6.23 billion, making it the third-largest layer-2 DEX network.
Unichain’s DeFi total value locked has continued gaining momentum. It rose by over 28% in the last 30 days to over $1.17 billion. This makes it significantly larger than Cardano (ADA), a popular blockchain with less than $350 million in assets.
Unichain’s total transactions have continued rising in the past few months. Its transactions rose by 42% in June, making it one of the fastest-growing chains in the crypto industry.
Another bullish signal: whale holdings of UNI have surged 58% over the past 30 days to 5.69 million. Public figure investors increased their holdings by 1,162% to 176,748 UNI, while the top 100 addresses grew their balances by 16% to 812 million UNI.
Uniswap price chart analysis
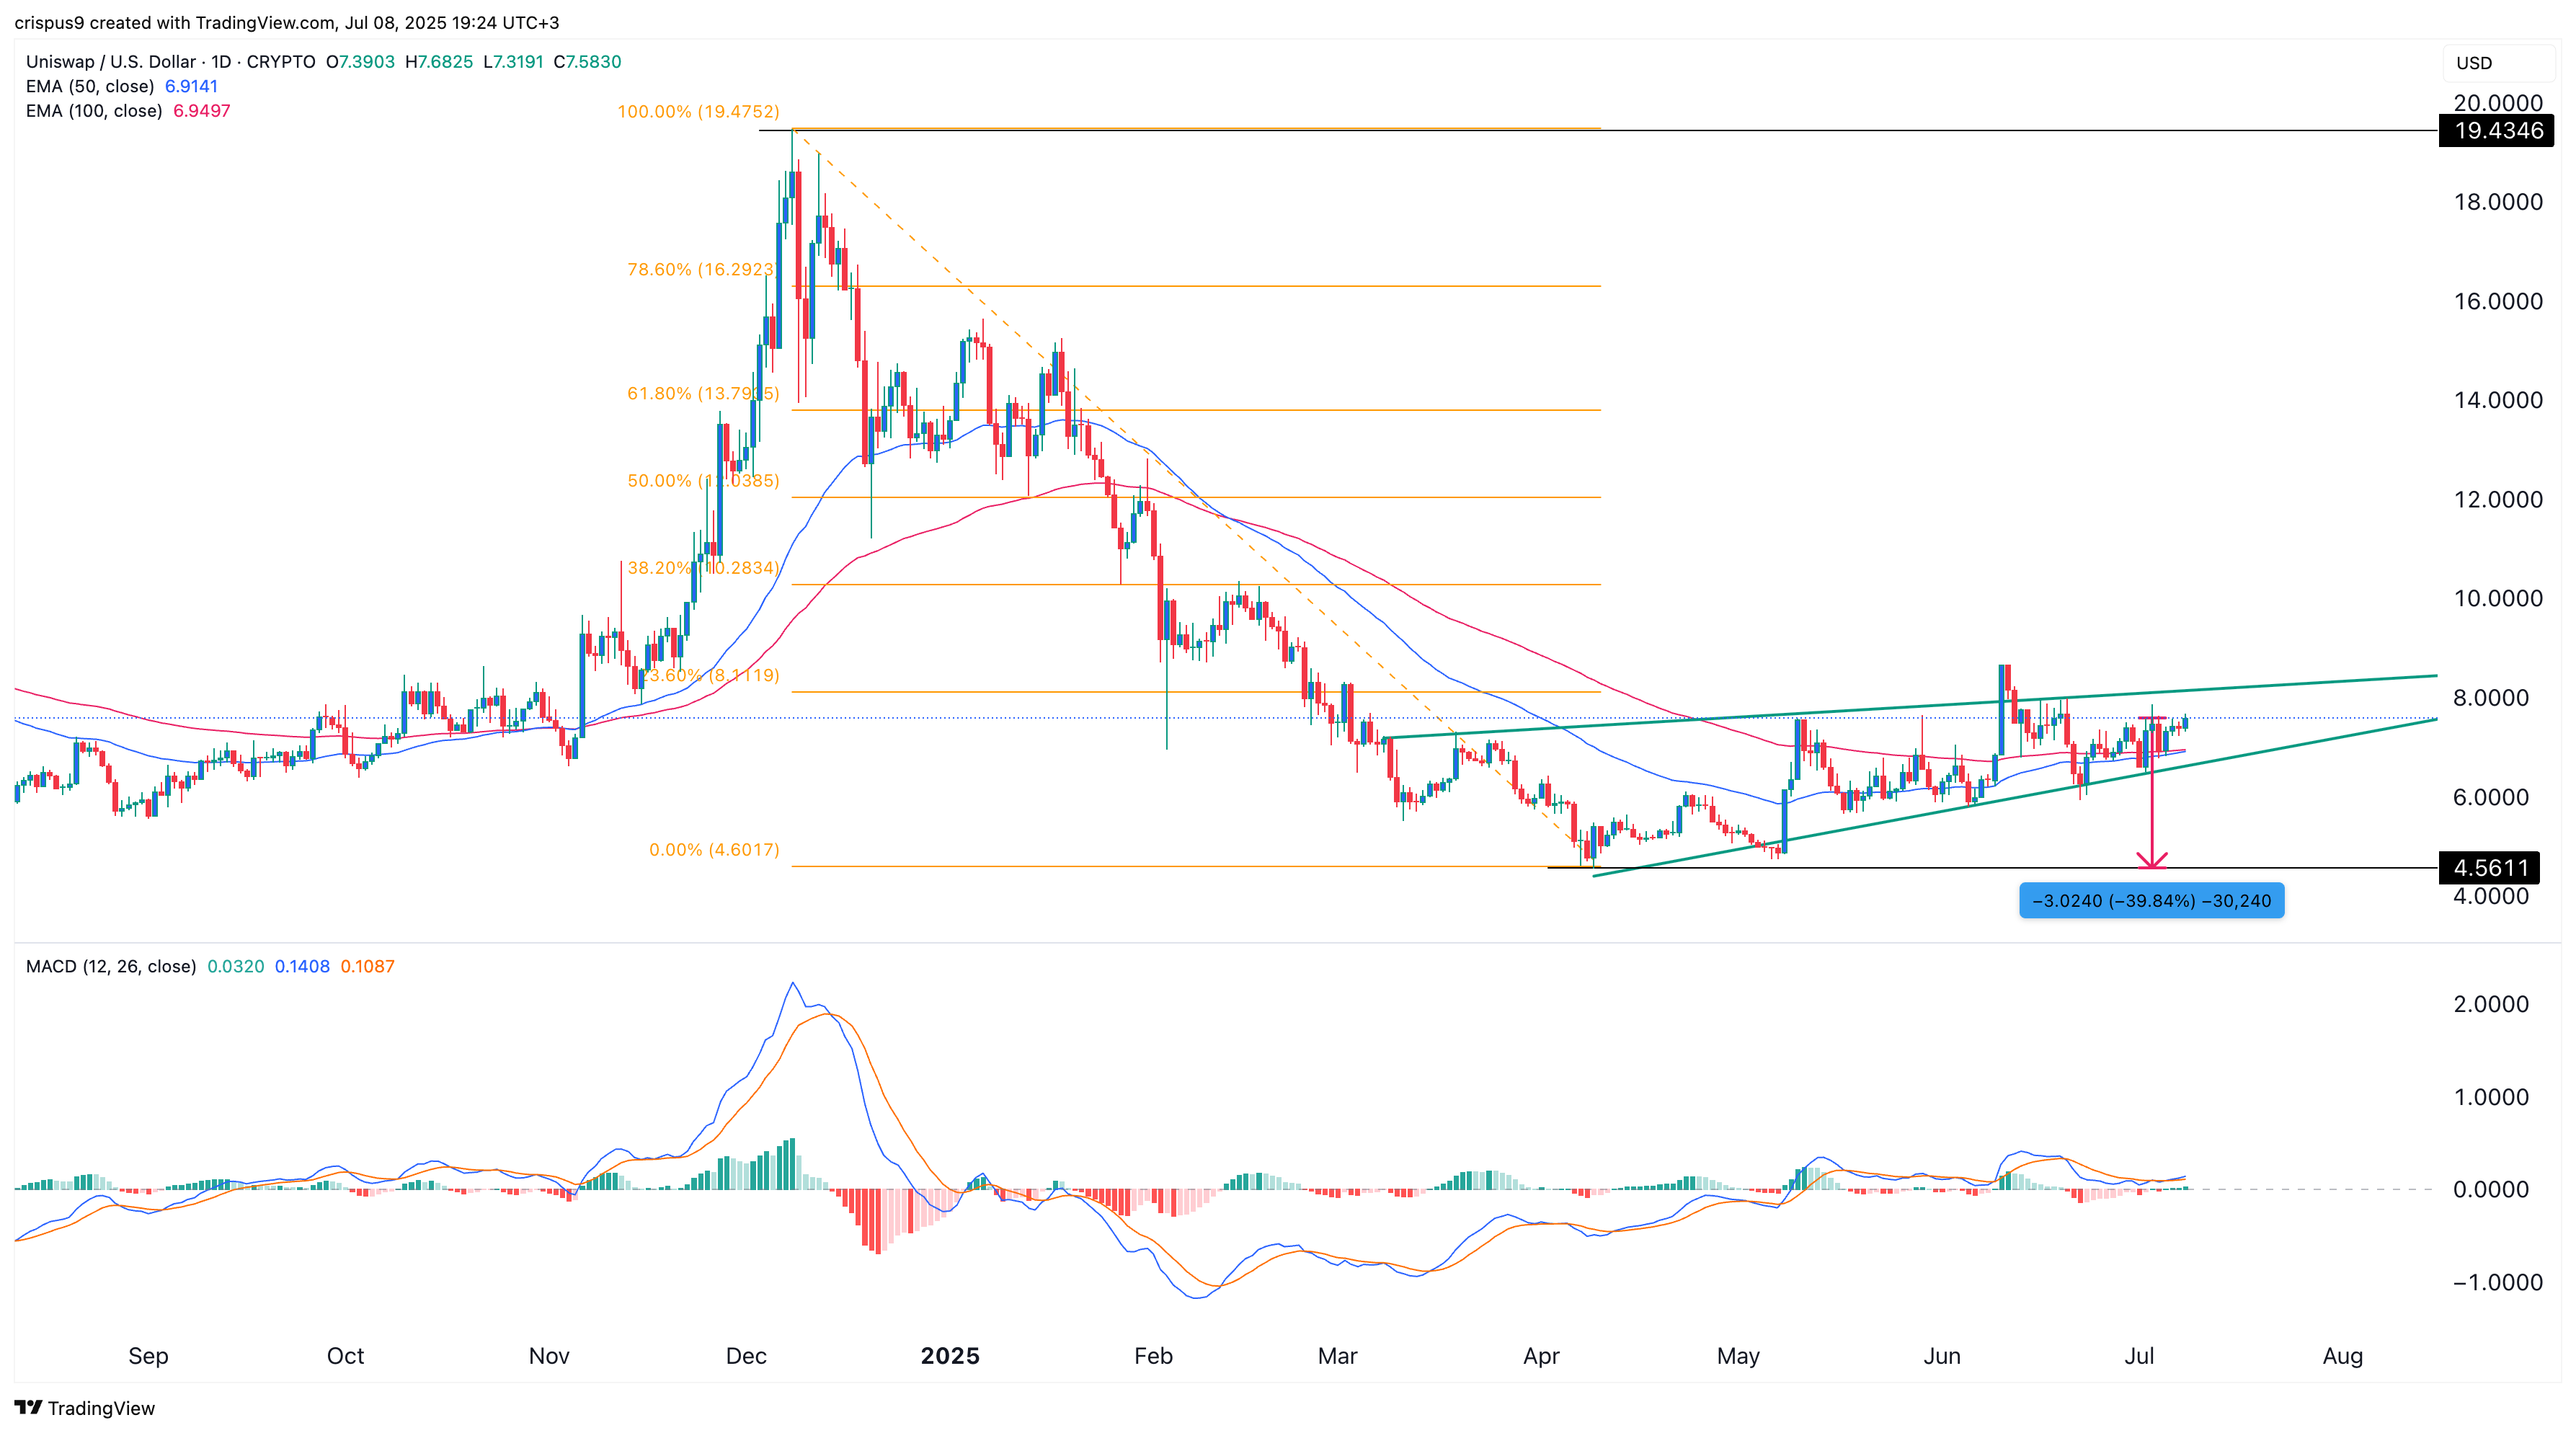
The daily chart shows that UNI has dropped from its 2023 high of $19.44 to the current $7.53. It remains below the 23.6% Fibonacci retracement level of $8.10.
The MACD indicator is signaling a bearish divergence, and the price has formed a rising wedge, a bearish chart pattern with ascending, converging trendlines. As the pattern nears confluence, a downside breakout is becoming more likely.
If this happens, the next level to watch will be at $4.60, its lowest level this year, which is about 40% below the current level.
