TIA Surges 14%—But Can Celestia’s Rally Defy Weak Fundamentals and Selling Pressure?

Celestia’s TIA token rockets up 14%—on paper. But dig deeper, and the cracks start showing.
Pump now, pay later? The modular blockchain darling faces a brutal reality check as sell walls and shaky fundamentals loom. Market makers are playing hot potato with retail bags—classic crypto.
Gravity always wins. When the liquidity music stops, TIA holders might regret ignoring the red flags. Another 'fundamentals optional' altcoin season special.
Bearish overhang persists despite today’s rally
On-chain data for Celestia presents a more cautious picture.
According to DeFiLlama, the total value locked in Celestia’s DeFi protocols has declined by over 95%, falling from a peak of $64.28 million in March 2024 to just $2.31 million at present.
Similarly, daily chain fees, often a proxy for user engagement, have dropped from $3,400 in March to a current average of around $200, reflecting reduced on-chain activity.
Sentiment indicators also remain subdued. According to data from social analytics platform Dexu AI, TIA ranks among the lowest in social sentiment across major crypto assets, suggesting a lack of positive engagement from the broader retail community.
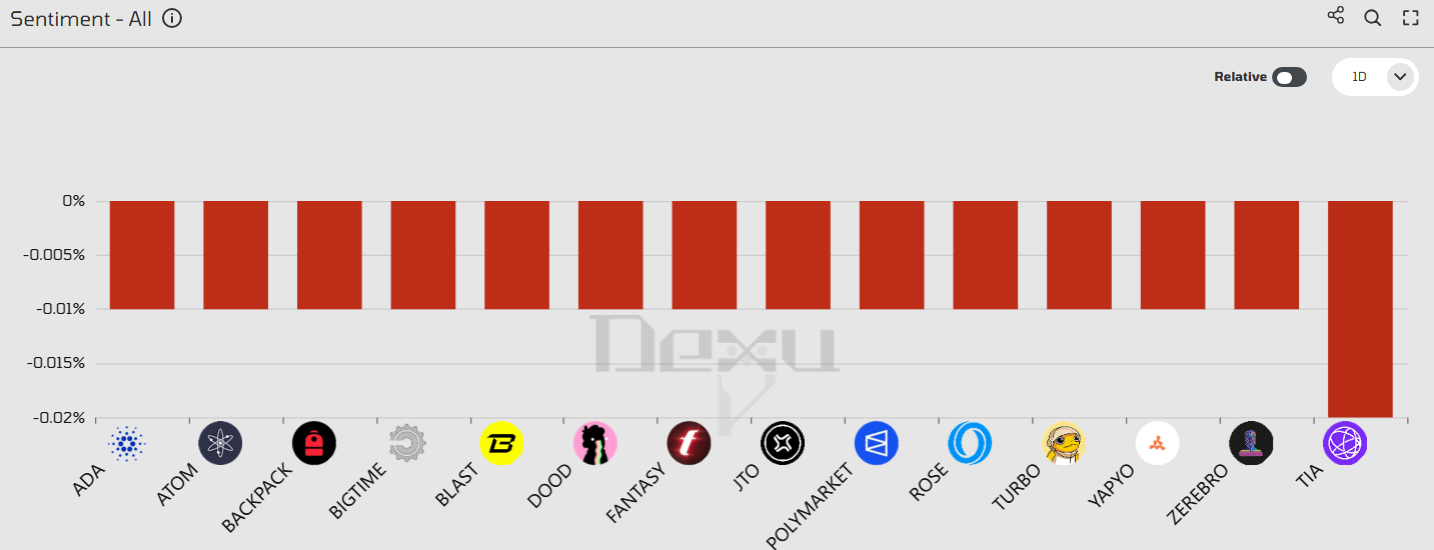
It contrasts sharply with the price rally, raising questions about the sustainability of the current uptrend in the absence of stronger fundamental or community-driven support.
Investor concerns are further exacerbated by continued sell pressure from early backers. Notably, Polychain Capital, one of Celestia’s earliest institutional investors, has reportedly sold over $242 million worth of TIA tokens since the project’s TGE. While the firm still holds around 44.7 million TIA, valued at approximately $63.9 million, any further liquidation from this wallet could negatively impact the price through increased circulating supply.
It is also important to note that, despite today’s rebound, TIA remains down approximately 92% from its all-time high, meaning the vast majority of holders are currently underwater. Such a dynamic raises the risk of profit-taking pressure should the token continue to recover.
Many investors may opt to exit positions NEAR breakeven, further limiting upside momentum in the short term.
TIA price analysis
On the 1-day USDT chart, the MACD line has crossed above the signal line, signaling an initial recovery in trend momentum. However, for a full bullish confirmation, both the MACD and the signal line would need to rise above the zero axis, indicating a transition from negative to positive momentum on a broader scale.
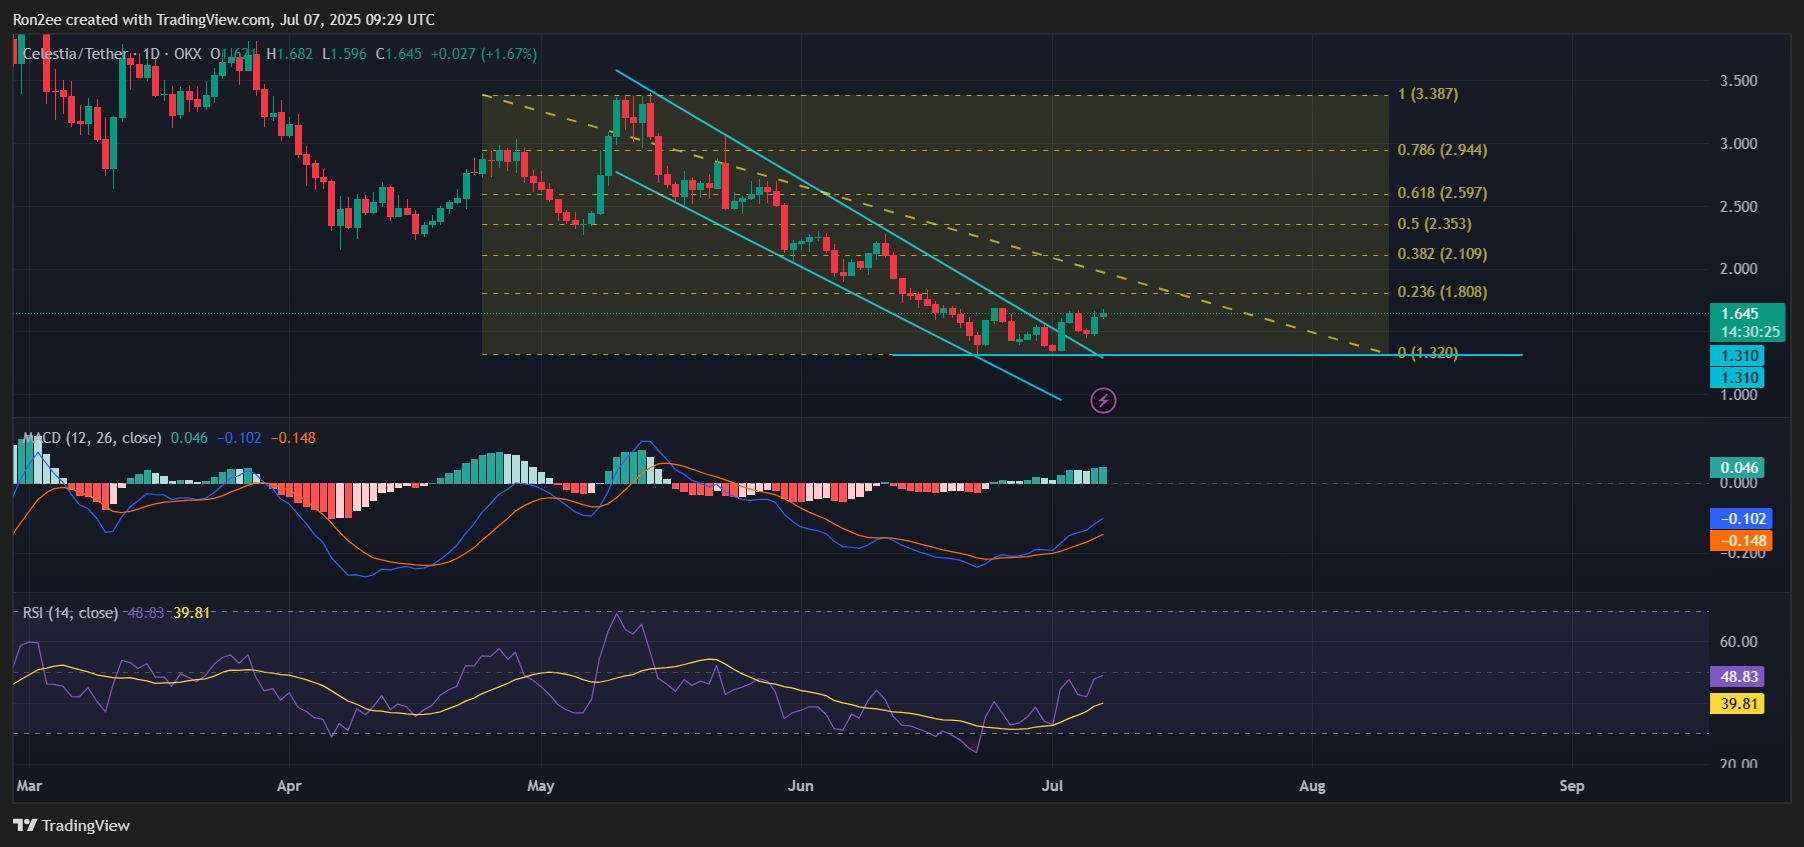
Meanwhile, the Relative Strength Index currently stands at 49, hovering just below the neutral 50 mark. The reading suggests that while bearish pressure has weakened, buyers have yet to assert full control. A decisive MOVE above 50 would strengthen the case for a continued bullish reversal.
Given these mixed momentum signals, the short-term outlook hinges on whether the current bullish sentiment among investors remains sustained. If so, a daily close above $1.68, which marks today’s intraday high, could act as a technical trigger for further upside.
The next key resistance levels to monitor include the June 5 swing low at $1.93, followed by the psychological round number of $2.00.
Conversely, if buying momentum weakens and price fails to hold above immediate support, a pullback toward the $1.31 level remains a plausible scenario. This would place TIA back within its recent consolidation range, delaying any meaningful trend reversal and keeping the token in a broader sideways structure.
Disclosure: This article does not represent investment advice. The content and materials featured on this page are for educational purposes only.

Log in to Reply
Log in to comment your thoughtsComments
Related Articles
|Square
Get the BTCC app to start your crypto journey
Get started today Scan to join our 100M+ users