Quant Price Poised for 70% Surge as Rare Bull Pattern Emerges

Quant’s chart just flashed a signal that’s got traders scrambling—a rare technical pattern suggesting a 70% upside explosion could be imminent.
### The Setup: A Textbook Bullish Breakout
QNT’s price action has coiled into a formation that historically precedes violent moves. Forget Wall Street’s ‘diversification’ dogma—this is where degenerate crypto gains are made.
### Why 70% Matters
The pattern’s measured move target aligns eerily with key liquidity zones. Even the suits hedging with Bitcoin ETFs might peek at this one.
### Caveat Emptor (Or: The Fine Print)
Of course, in crypto-land, ‘textbook patterns’ sometimes turn into coloring book disasters. Watch those stops—unless you enjoy funding whales’ lambos.
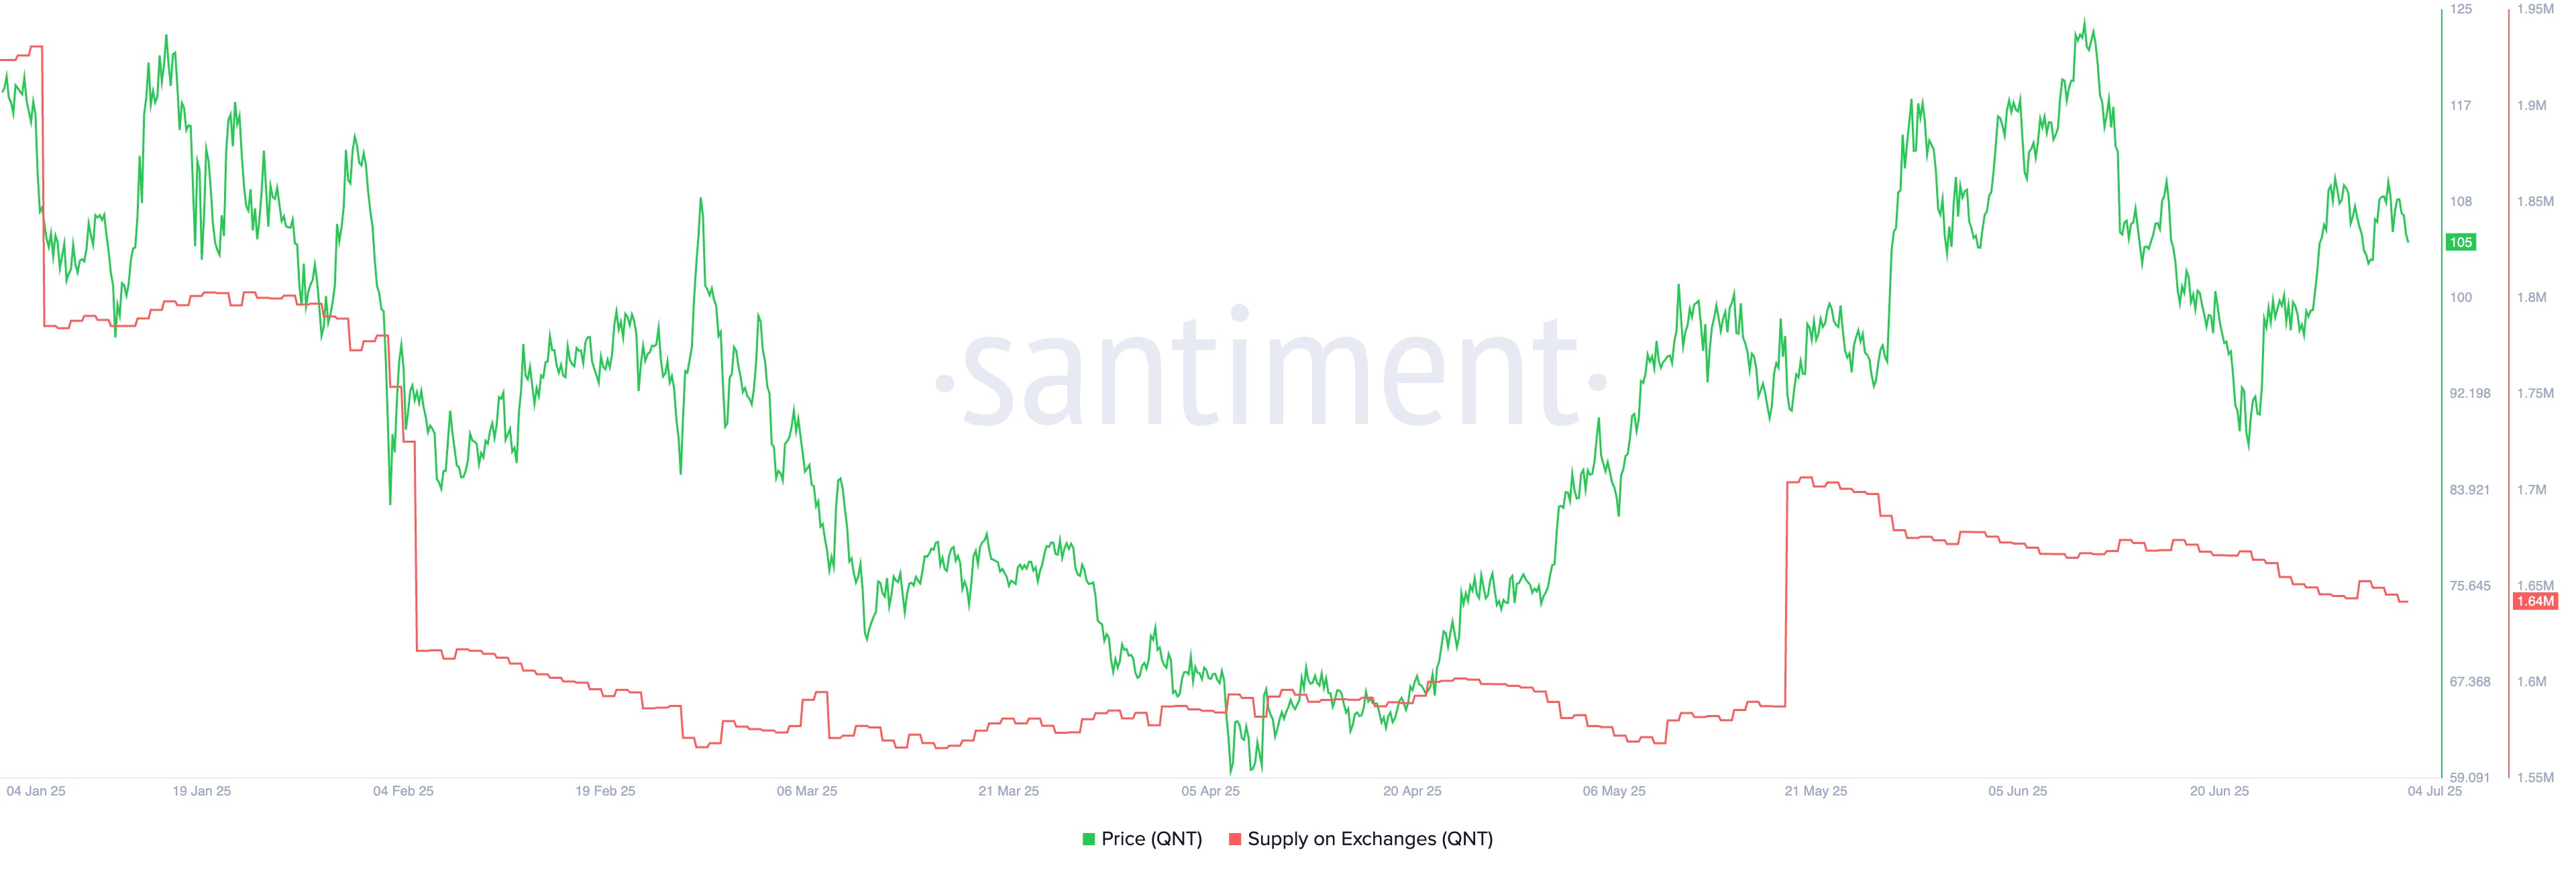 QNT exchage balances | Source: Santiment
Quant price technical analysis
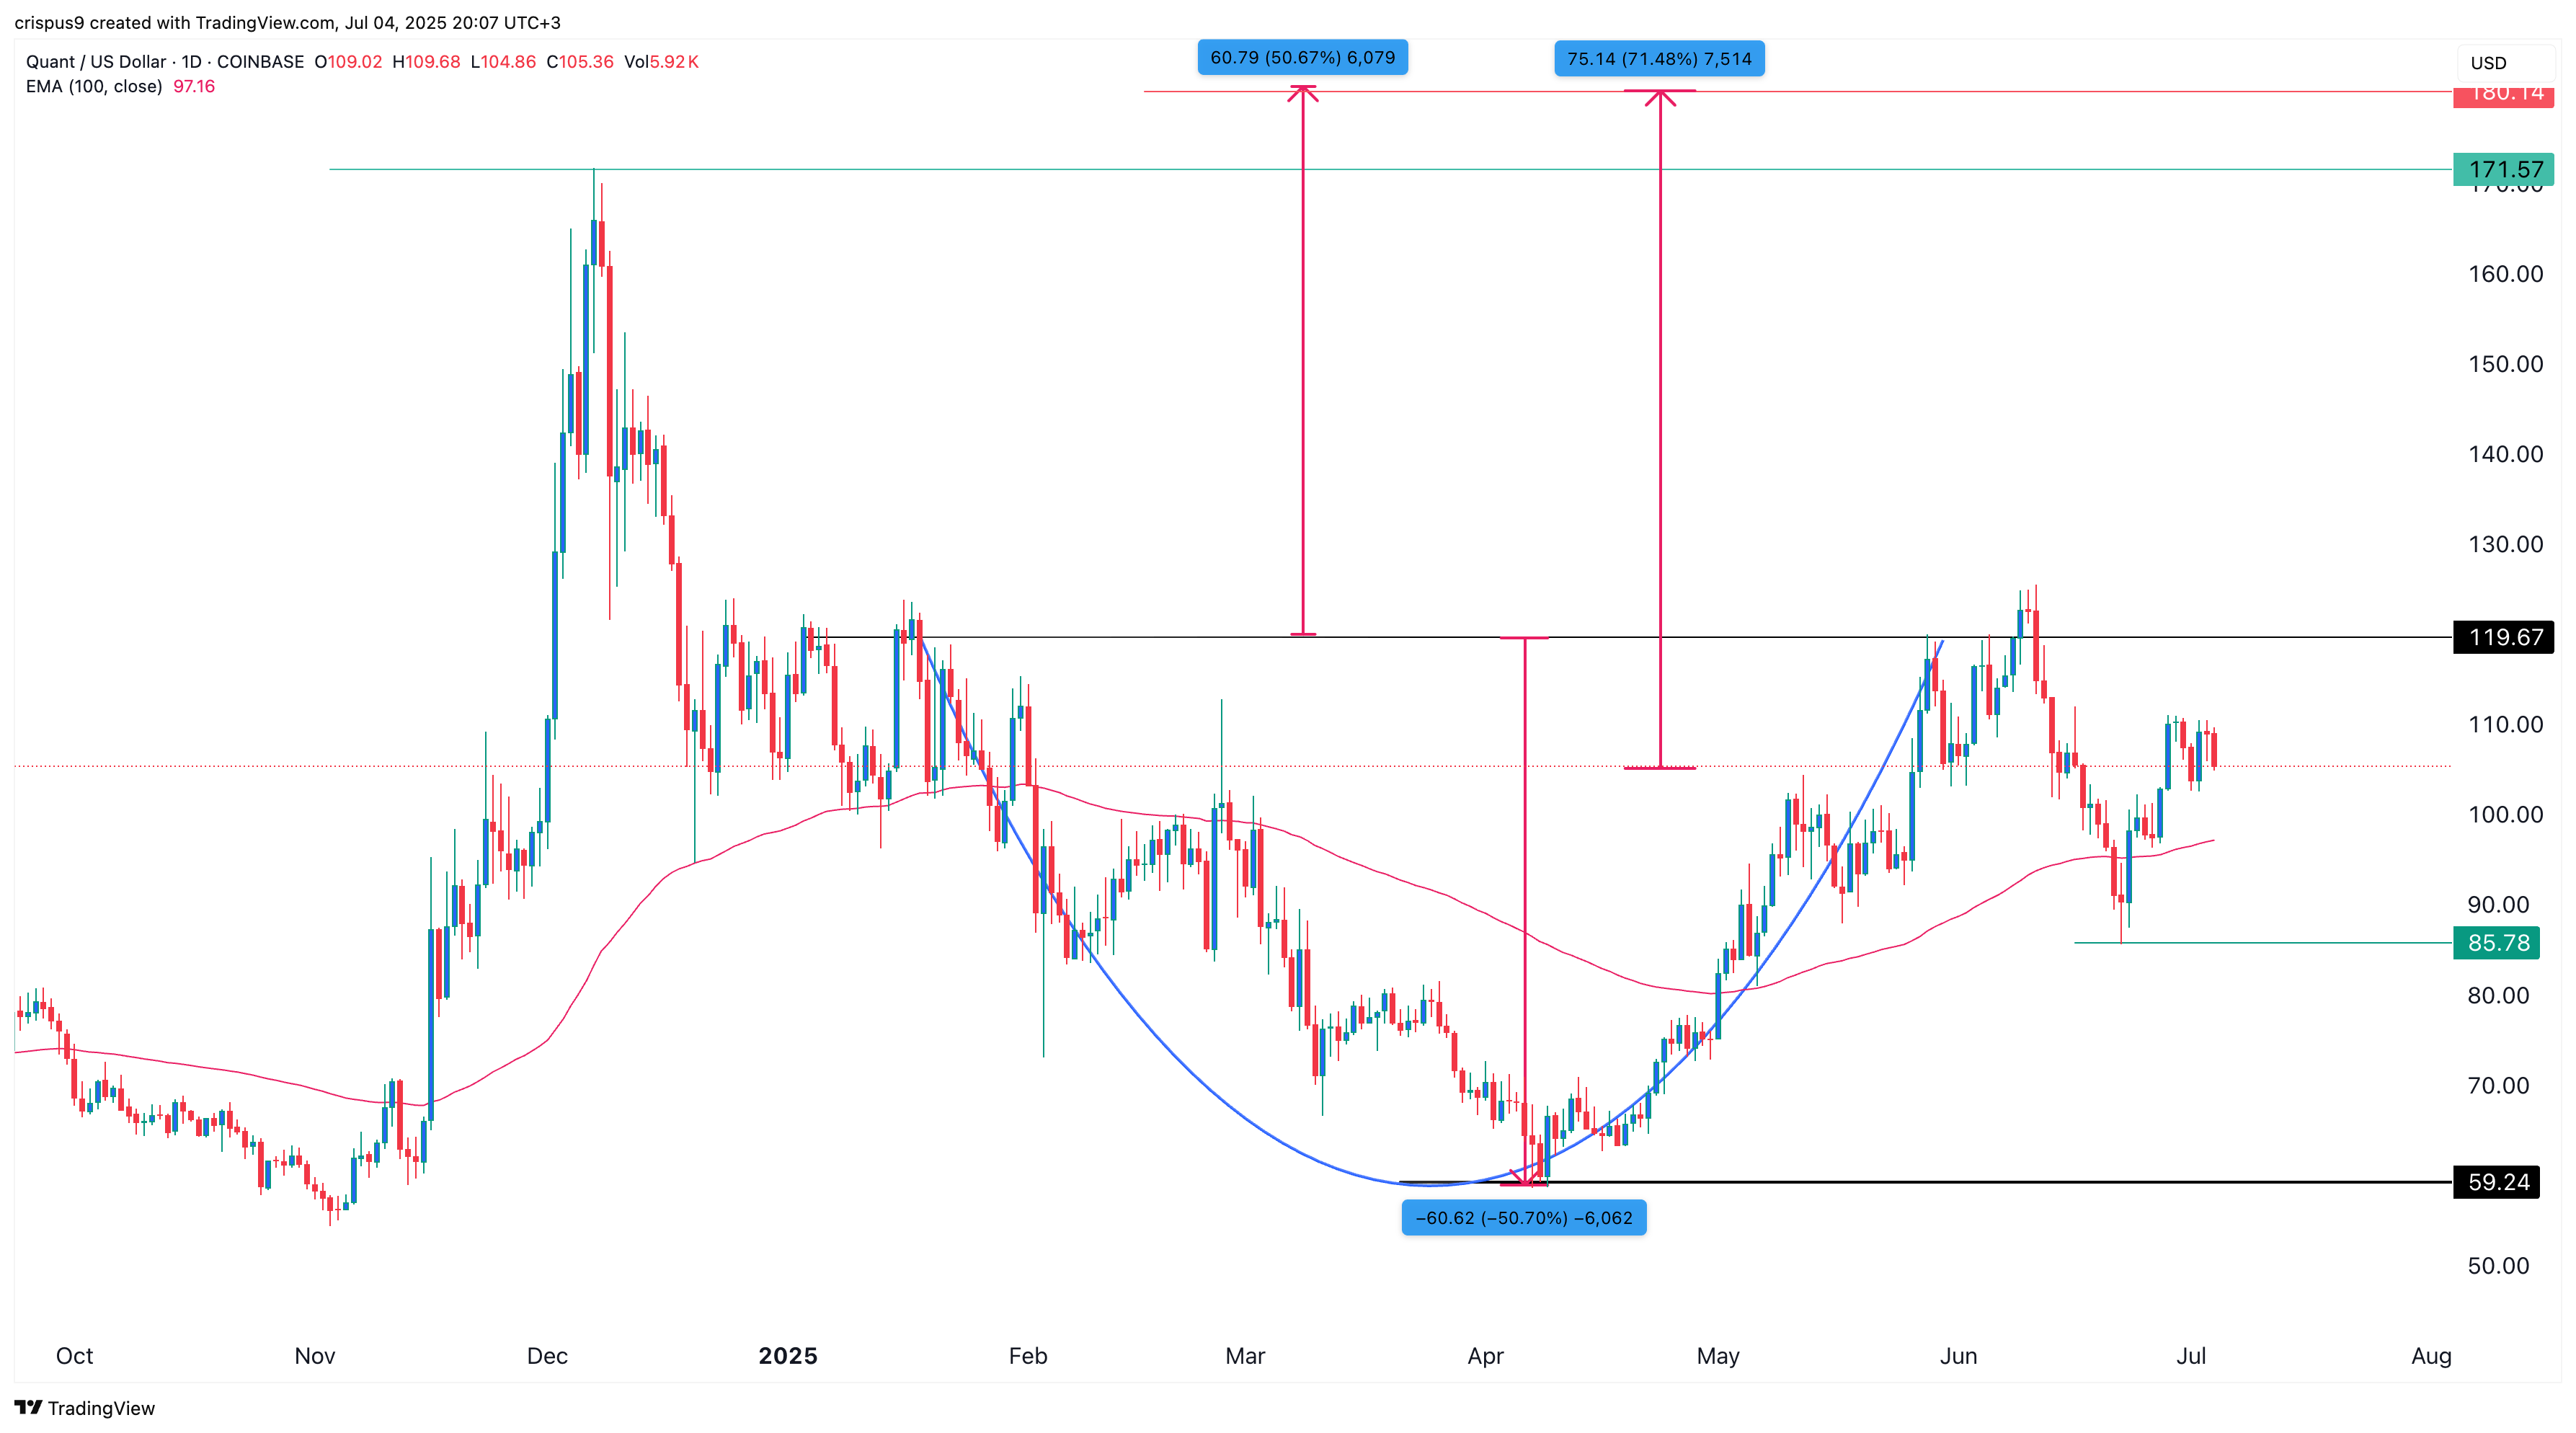
The daily chart indicates that QNT bottomed at $59.25 in April and rebounded to $120 in June. It has formed a cup-and-handle pattern, characterized by two distinct swings and a rounded bottom. The recent retreat represents the handle portion of this formation.
The distance between the cup’s upper and lower bounds is approximately 50%. Projecting this same distance from the upper boundary points to a potential rally toward $180, representing a 71% gain from the current level. However, this bullish forecast WOULD be invalidated if the token drops below the support level at $85.78.
