🚨 Cardano Price Surge Forms High-Stakes Pattern – What Traders Missed

Cardano's bullish run just flashed a warning sign that'll make technical analysts reach for their charts. The third-generation blockchain's native token ADA isn't just climbing—it's painting a pattern that historically precedes major reversals.
Here's why smart money is watching the 4-hour candles.
The Risky Formation You Can't Ignore
While retail traders chase green candles, the weekly chart shows ADA forming a textbook-perfect rising wedge. These patterns typically resolve downward—hard. The last time Cardano showed this formation, it corrected 40% in three weeks.
Bull Trap or Breakout Fuel?
Market veterans know wedges can snap either way. A clean breakout above resistance could send ADA to new yearly highs. But with leverage ratios hitting extremes and perpetual funding rates turning juicy, the smart play might be waiting for confirmation—something most degens won't do.
As always in crypto, the 'this time it's different' crowd will argue fundamentals until their portfolios turn red. Meanwhile, OGs are quietly setting sell orders—because even in decentralized finance, gravity still applies.
Cardano price technical analysis
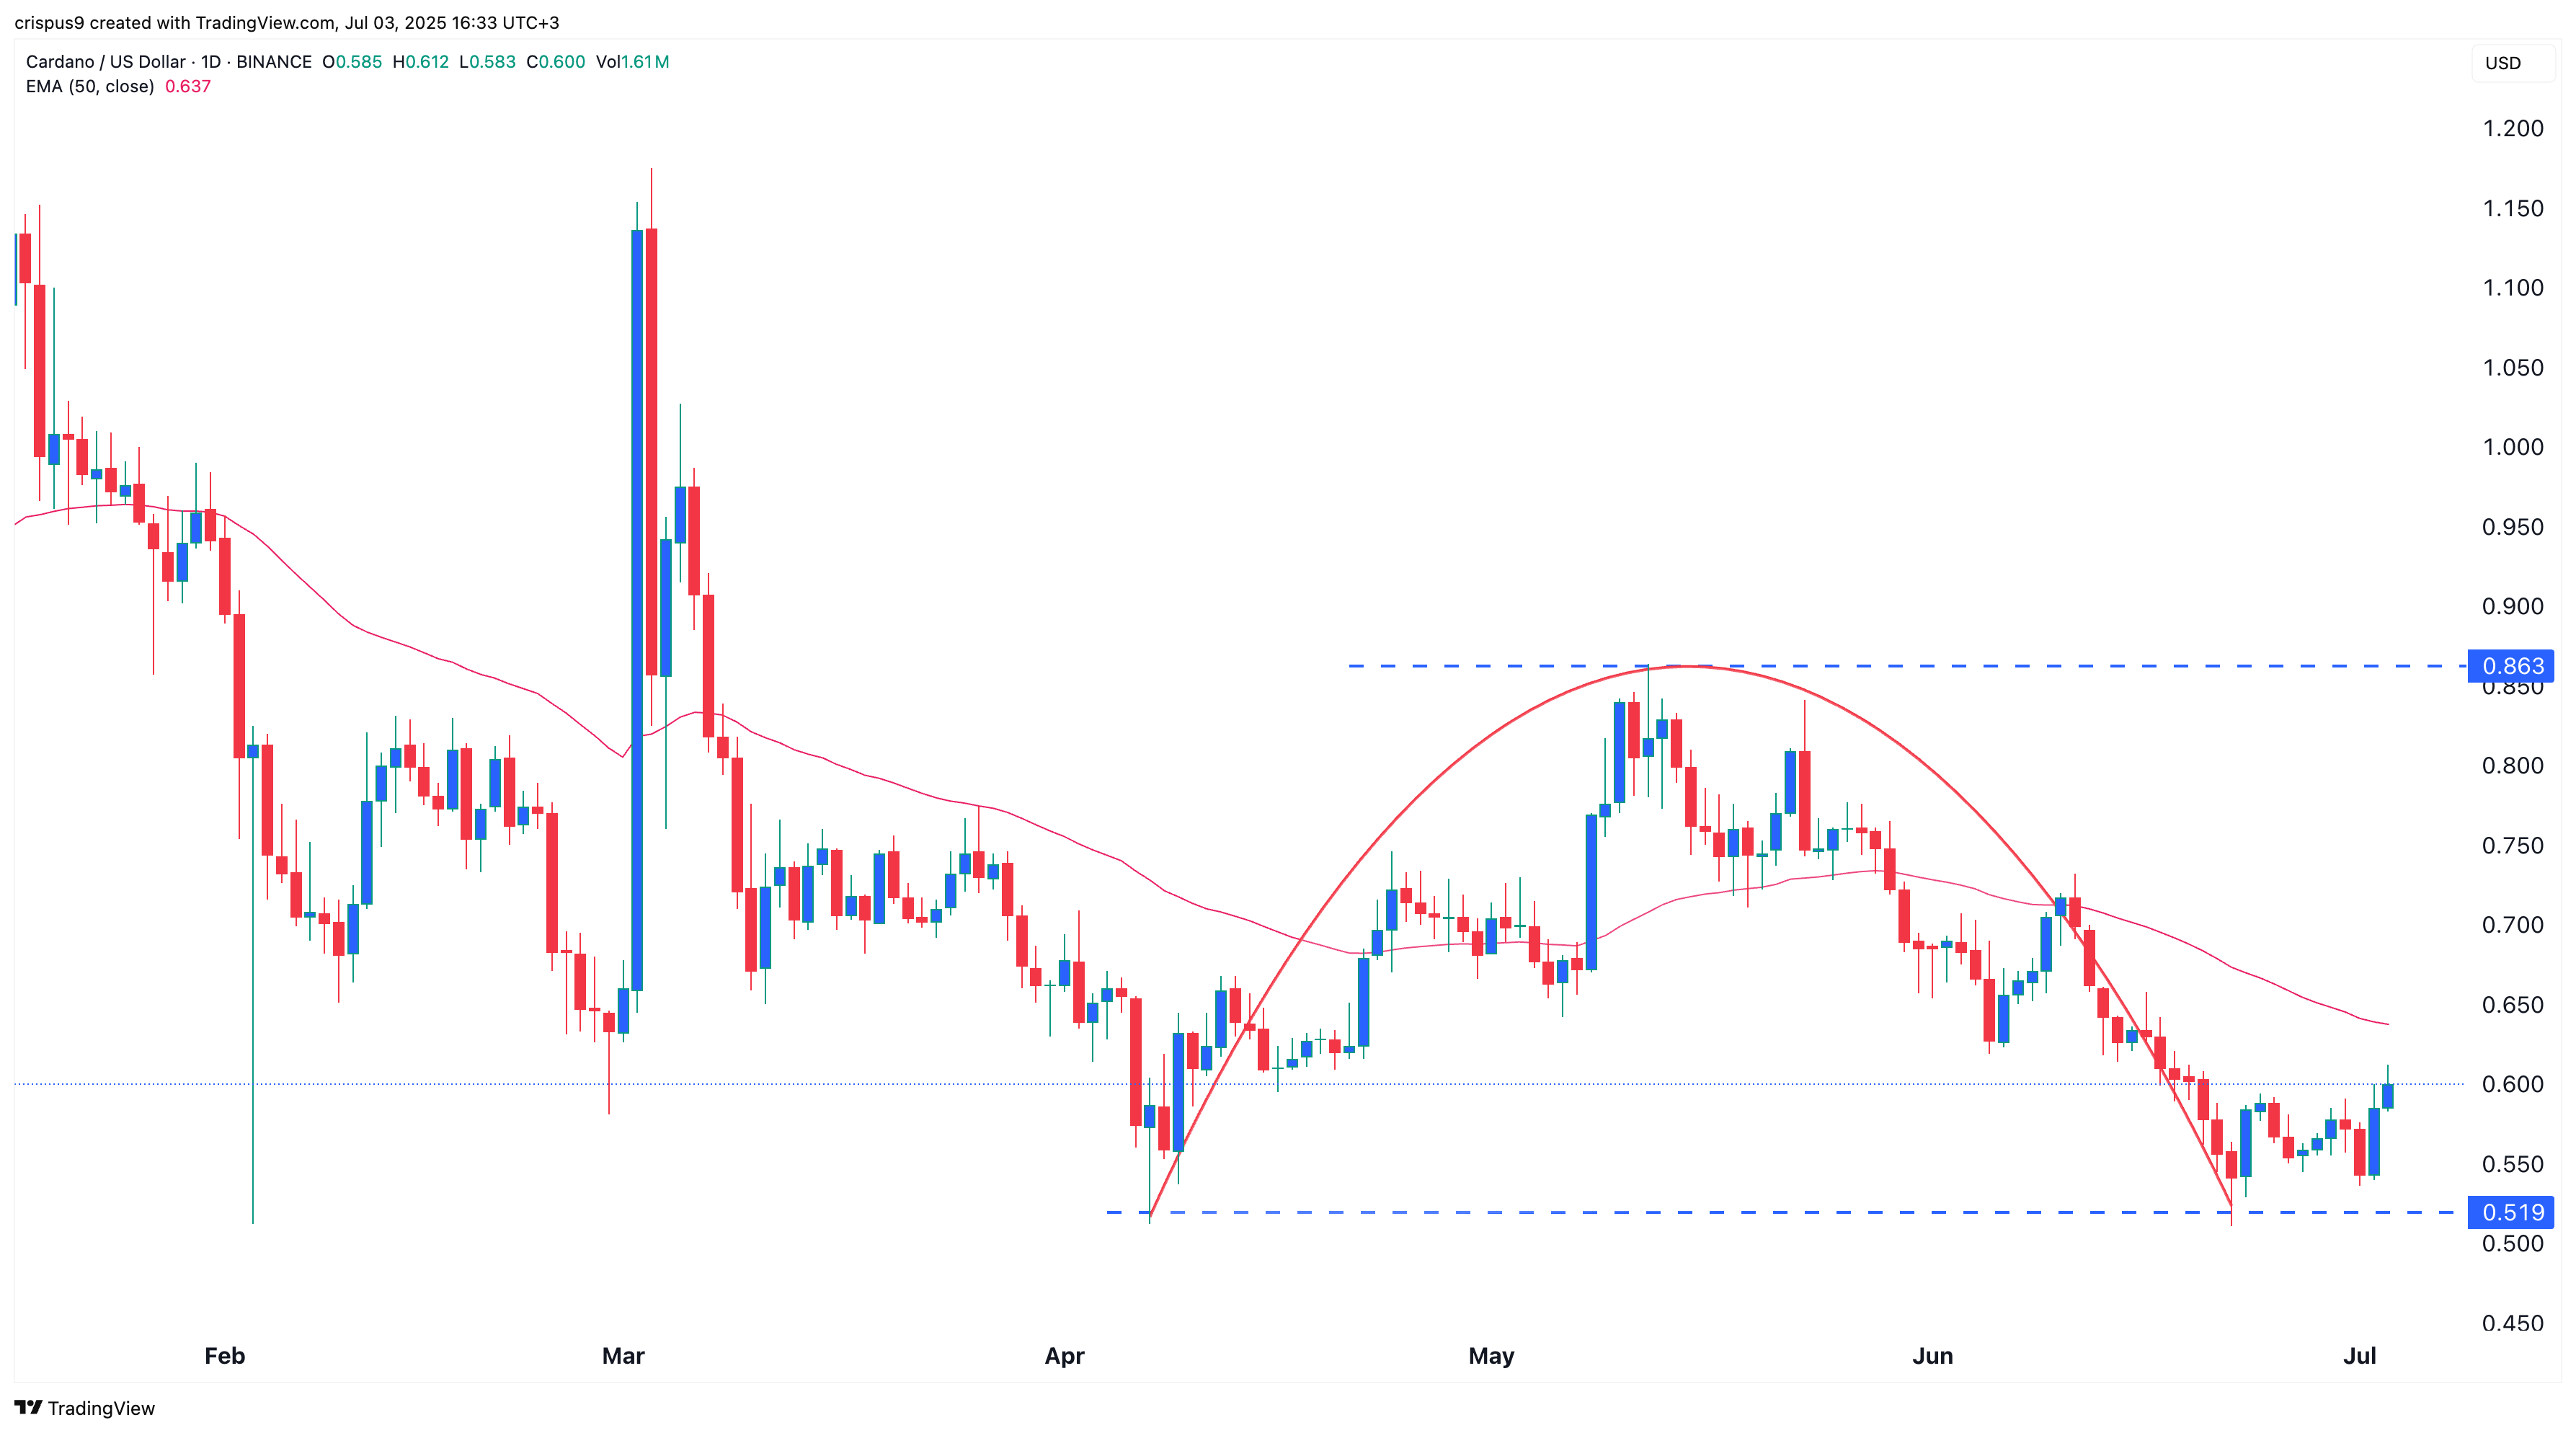
The daily chart shows that Cardano price dropped and bottomed at $0.519 in June this year. This was a notable level since it coincided with its lowest point in April.
The coin has formed a rounded top with an upper boundary at $0.863. More recently, ADA has developed a horizontal channel. Together, this price action suggests the formation of an inverse cup-and-handle pattern, with a depth of approximately $0.344.
Currently, Cardano remains below its 50-day and 100-day moving averages, signaling continued bearish control.
As such, a bearish breakout appears more likely in the NEAR term. If the breakdown occurs, the initial target will be $0.519, the lower edge of the cup pattern. A move below that level could open the door to further declines toward $0.50 and below.

Log in to Reply
Log in to comment your thoughtsComments
Related Articles
|Square
Get the BTCC app to start your crypto journey
Get started today Scan to join our 100M+ users