Polkadot Eyes Breakout as $3.75 Support Holds Firm – Is Range-Bound Consolidation the Calm Before the Storm?

Polkadot's price action just got interesting. The cross-chain protocol is testing a critical $3.75 support level—a make-or-break zone that could determine its next major move.
Range-bound but not out of bounds
Traders are seeing textbook consolidation patterns after recent volatility. The $3.75 level isn't just psychological support—it's become the floor for what's shaping up to be a classic accumulation phase. (Because what's crypto without its periodic 'wait and see' dramas?)
What the charts won't tell you
While TA enthusiasts draw their trendlines, the real question is whether DOT's fundamentals can back a breakout. The network's parachain auctions keep humming along, but let's be real—in this market, even the best tech sometimes plays second fiddle to meme coin mania.
One thing's certain: when this range breaks, it'll do so in style. The only question is which direction. Buckle up.
Key technical points
- $3.75 High Time Frame Support: Major structural support with confluence from the value area low and point of control.
- Potential Reversal Zone: Historical demand area not seen since October 2023, signaling a possible macro low.
- Bearish Market Structure: Still intact with lower highs and lows; confirmation needed via a higher low and breakout above local high.
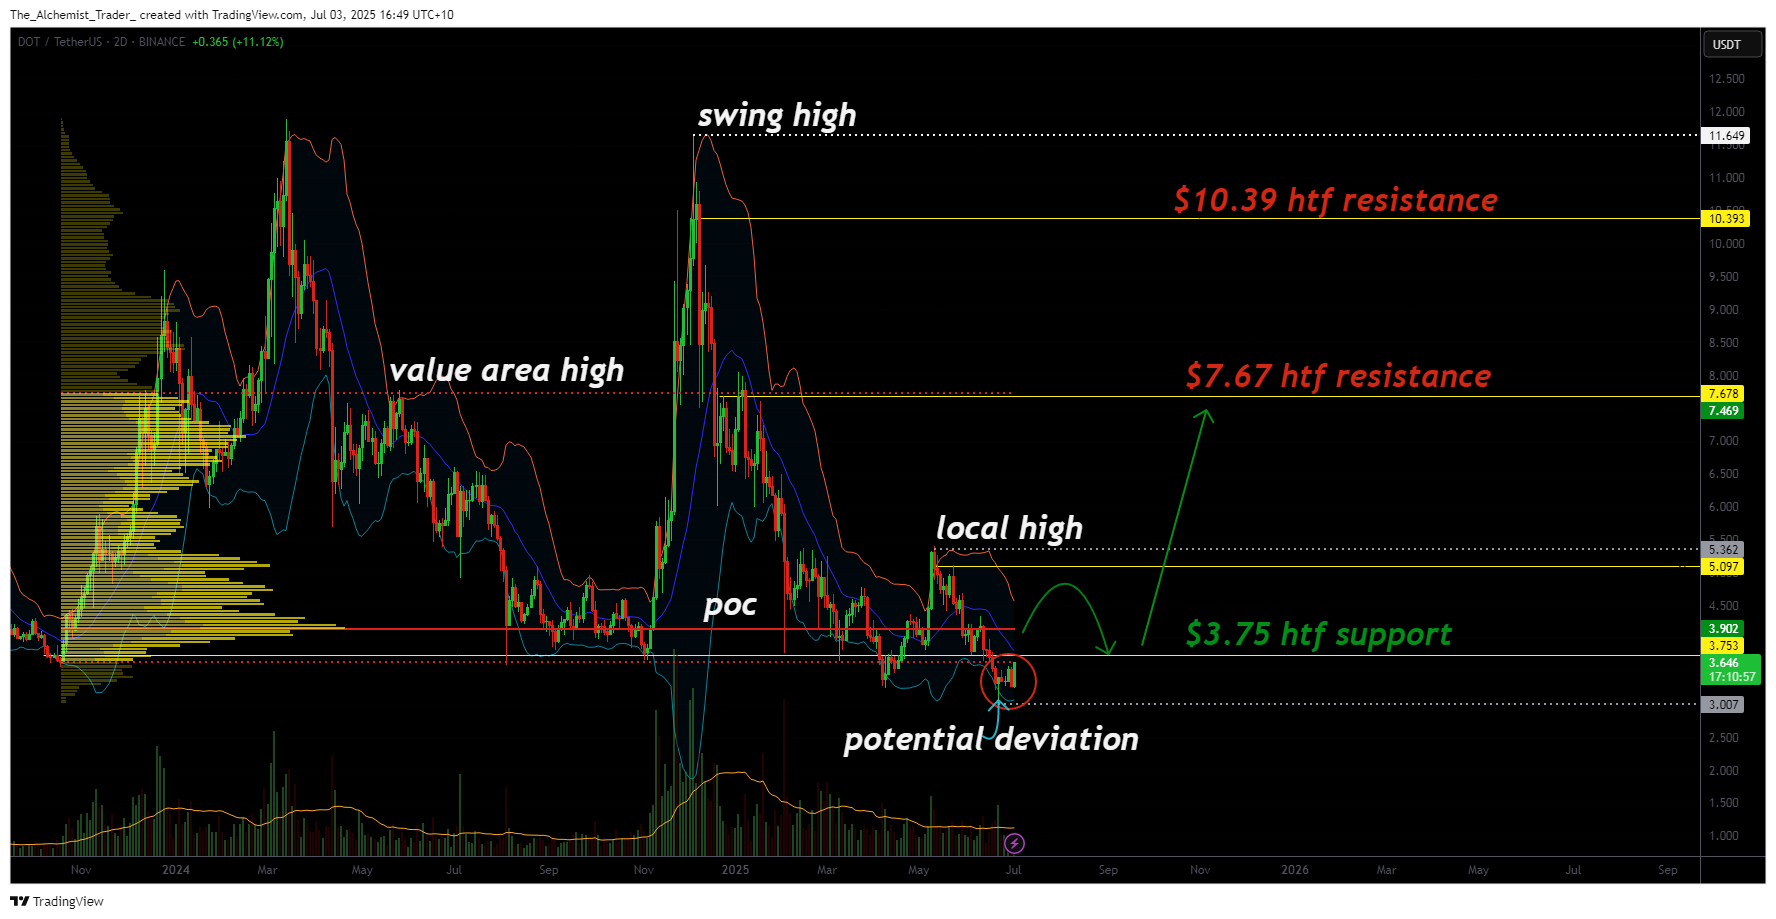
The $3.75 region is more than just a psychological level, it represents a multi-month value area low and aligns with the point of control for DOT’s price action dating back to October 2023. This triple confluence zone makes it a major area of interest, where buyers historically stepped in to reverse trend momentum. The fact that DOT has returned to this level gives technical traders a potential opportunity to observe a significant macro low forming.
Price action has been in a relentless downtrend since printing its swing high. While there was a local high formed in an attempted bounce, the entire MOVE was retraced, highlighting continued bearish pressure. Now, however, DOT is testing the very base of its high time frame trading range, where price historically pivots and begins a new cycle back toward the range highs.
For bullish continuation to be confirmed, a shift in market structure is necessary. Currently, DOT is still forming lower lows and lower highs. A reversal scenario WOULD require the price to reclaim the $3.75 level decisively, take out the local high, and then print a higher low.
This would indicate a break in bearish structure and confirm demand in the zone. Only then can a rotation toward the $7.67 resistance level, the upper boundary of the larger range, be expected with any conviction.
The current zone can also be interpreted as a deviation below value, particularly if price action quickly reclaims the point of control and confirms the move with increased volume. Such a deviation would suggest a bear trap at the range lows and open the probability for a sharp rally fueled by short covering and fresh accumulation.
What to expect in the coming price action
If DOT confirms support above $3.75 and breaks above the recent local high, a larger reversal toward $7.67 could begin. Until then, price action remains range-bound, and traders should monitor closely for a shift in market structure.

Log in to Reply
Log in to comment your thoughtsComments
Related Articles
|Square
Get the BTCC app to start your crypto journey
Get started today Scan to join our 100M+ users