Wormhole Price Forms Risky Pattern—Bullish Breakout or Coinbase Listing Trap?

Wormhole's chart flashes warning signs as it gears up for its Coinbase debut. Traders are torn—will this be a breakout play or a classic 'buy the rumor, sell the news' setup?
Technical tension mounts. The cross-chain token paints a precarious pattern—wedging between support and resistance like a DeFi degens' Rorschach test. Meanwhile, liquidity pools whisper of leveraged longing ahead of the listing.
Coinbase effect or coffin nail? History shows exchange listings cut both ways—remember when Arbitrum pumped 120% pre-listing only to dump 40% after? (Ah, the sweet smell of vaporized leverage.)
One hedge fund manager quipped: 'We're either frontrunning the dumb money or becoming it.' Grab your popcorn—this bridge might burn bright before it collapses.
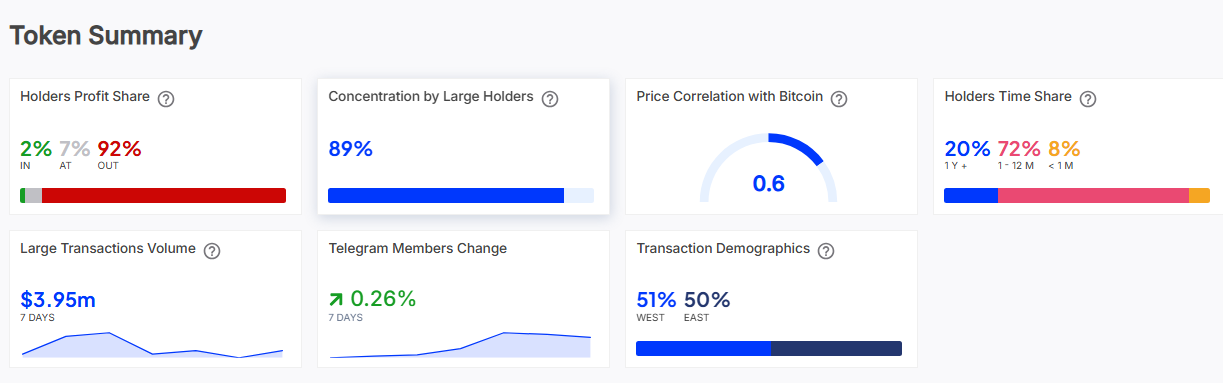 Source: IntoTheBlock
Additional data from Nansen highlights further weakness in investor confidence. Influencers and publicly known accounts have reportedly been offloading their Wormhole holdings over the past week.
Such actions by high-visibility figures often trigger negative sentiment among retail investors, adding to the selling pressure and undermining broader market support.
W price analysis
Wormhole’s market structure is also showing signs of stress, with a bearish pattern forming.
On the 4-hour W/USDT chart, the token has broken below the lower boundary of an ascending broadening wedge, a volatile and typically bearish structure that had been forming since the token’s recent local bottom.
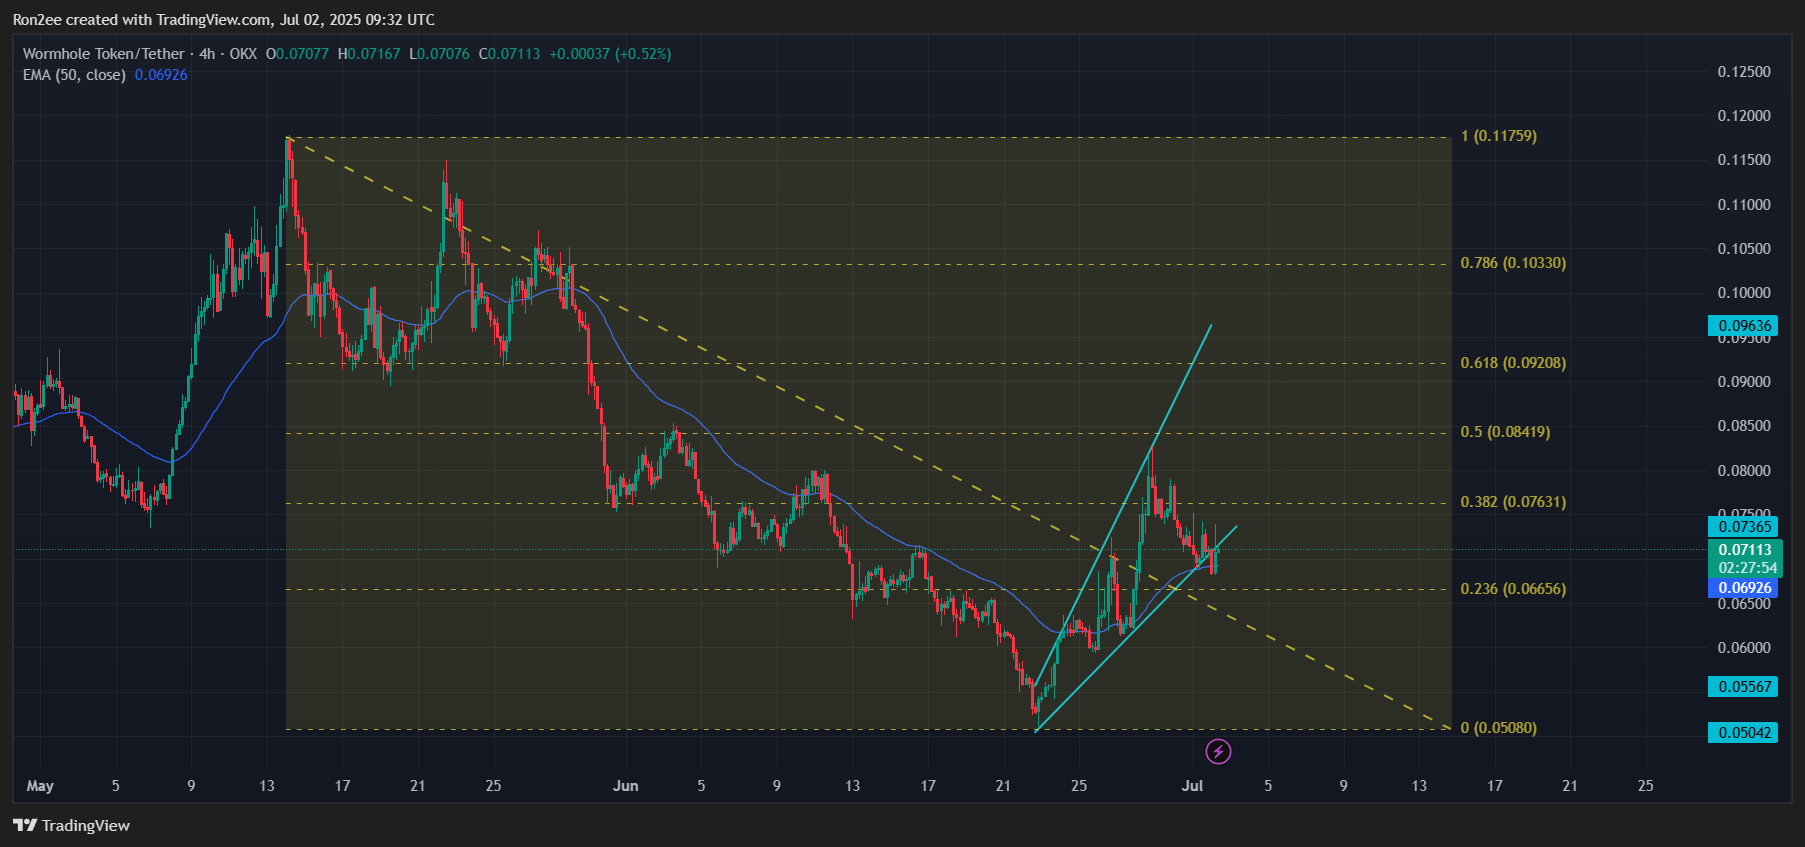
An ascending broadening wedge is characterized by expanding price swings and rising trendlines, which often means markets are becoming unstable and losing directional conviction. A breakdown below the lower trendline generally signals that bearish pressure is mounting and that a further drop may follow.
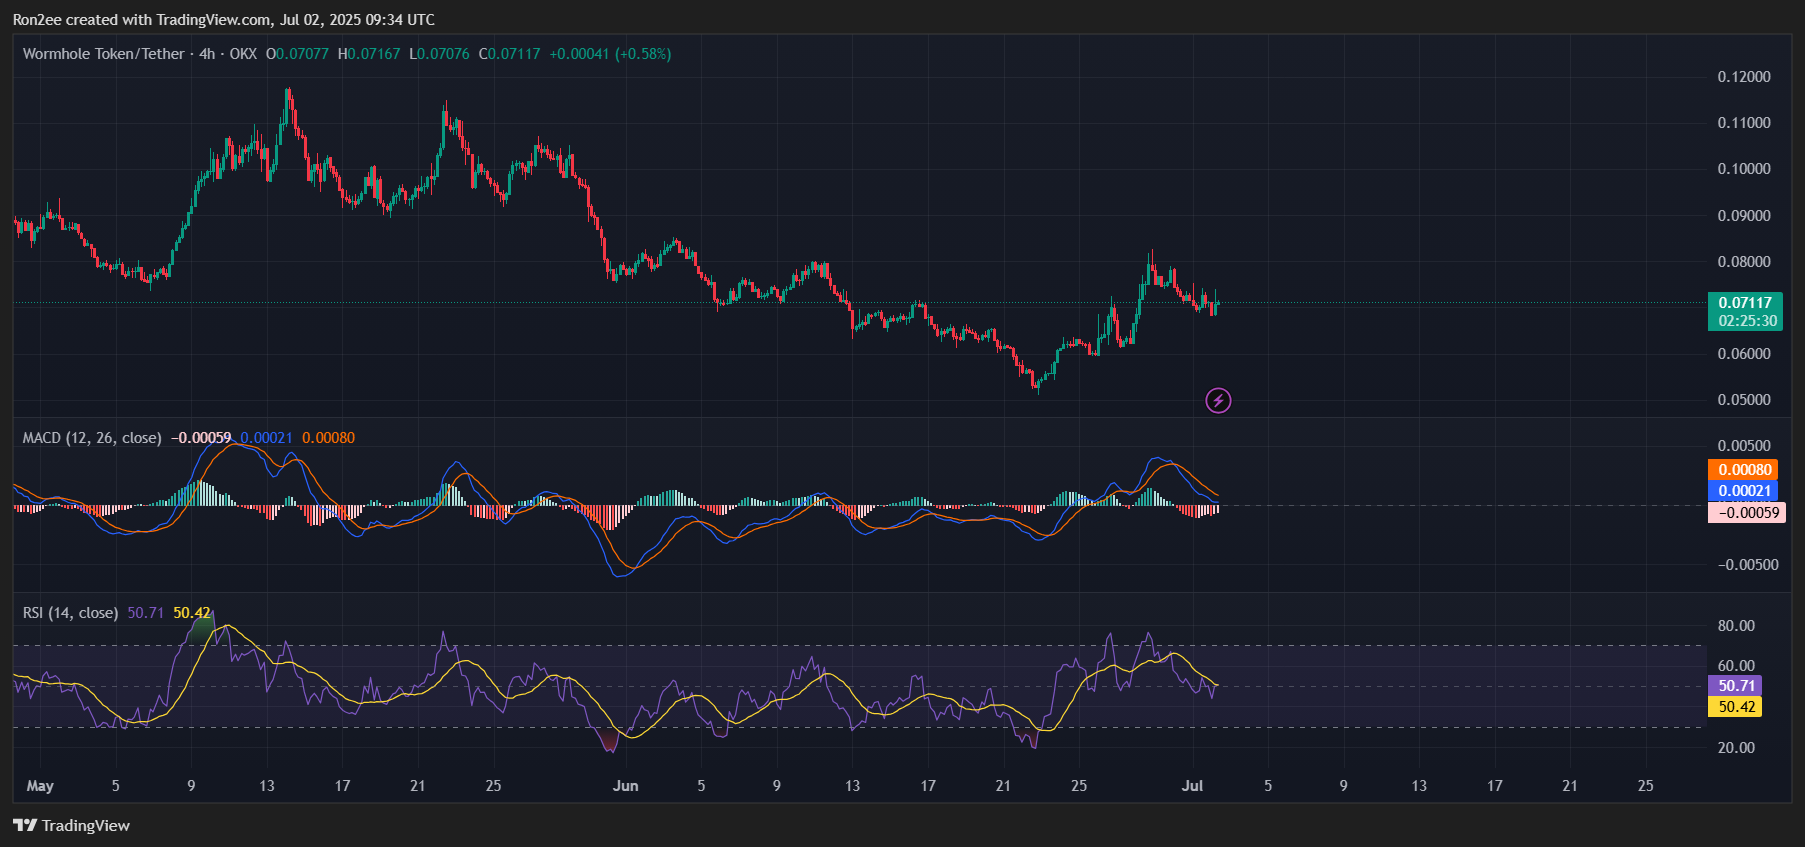
Momentum indicators support this bearish outlook. The MACD lines have crossed to the downside, while the Relative Strength Index has retreated to neutral levels at 50. This suggests that bullish momentum has dissipated, and sellers are taking over. A negative Chaikin Money FLOW reading further confirms this trend.
Given these conditions, W may be poised to retest the $0.066 level, which corresponds with the 23.6% Fibonacci retracement zone. A decisive break below this support could expose the token to further losses, potentially leading to a retest of its all-time low at $0.051.
This level may serve as a temporary support zone, provided selling pressure eases. However, failure to hold above it could result in a deeper price correction.
Disclosure: This article does not represent investment advice. The content and materials featured on this page are for educational purposes only.
