BNB on the Brink: Surging Network Metrics Signal Imminent Price Breakout

BNB isn't just flirting with a breakout—it's backed by network growth that'd make even Bitcoin blush. Here's why traders are scrambling.
Network activity rockets as BNB defies market gravity
While other chains play checkers, Binance's native token is out here winning at 3D chess—transactions, active addresses, and staking yields all screaming 'bullish'. The only thing missing? Wall Street 'experts' still calling it a scam while quietly accumulating bags.
Price charts show textbook accumulation pattern
That sideways action wasn't boredom—it was institutions loading up before the fireworks. Technicals now mirror the 2021 run-up, back when 'crypto winter' was just a Twitter meme.
Will this finally be the run where BNB flips ETH? Probably not—but watching the attempt will be glorious. Just don't tell your CFA friends you're investing in 'that casino asset' while it 10Xs again.
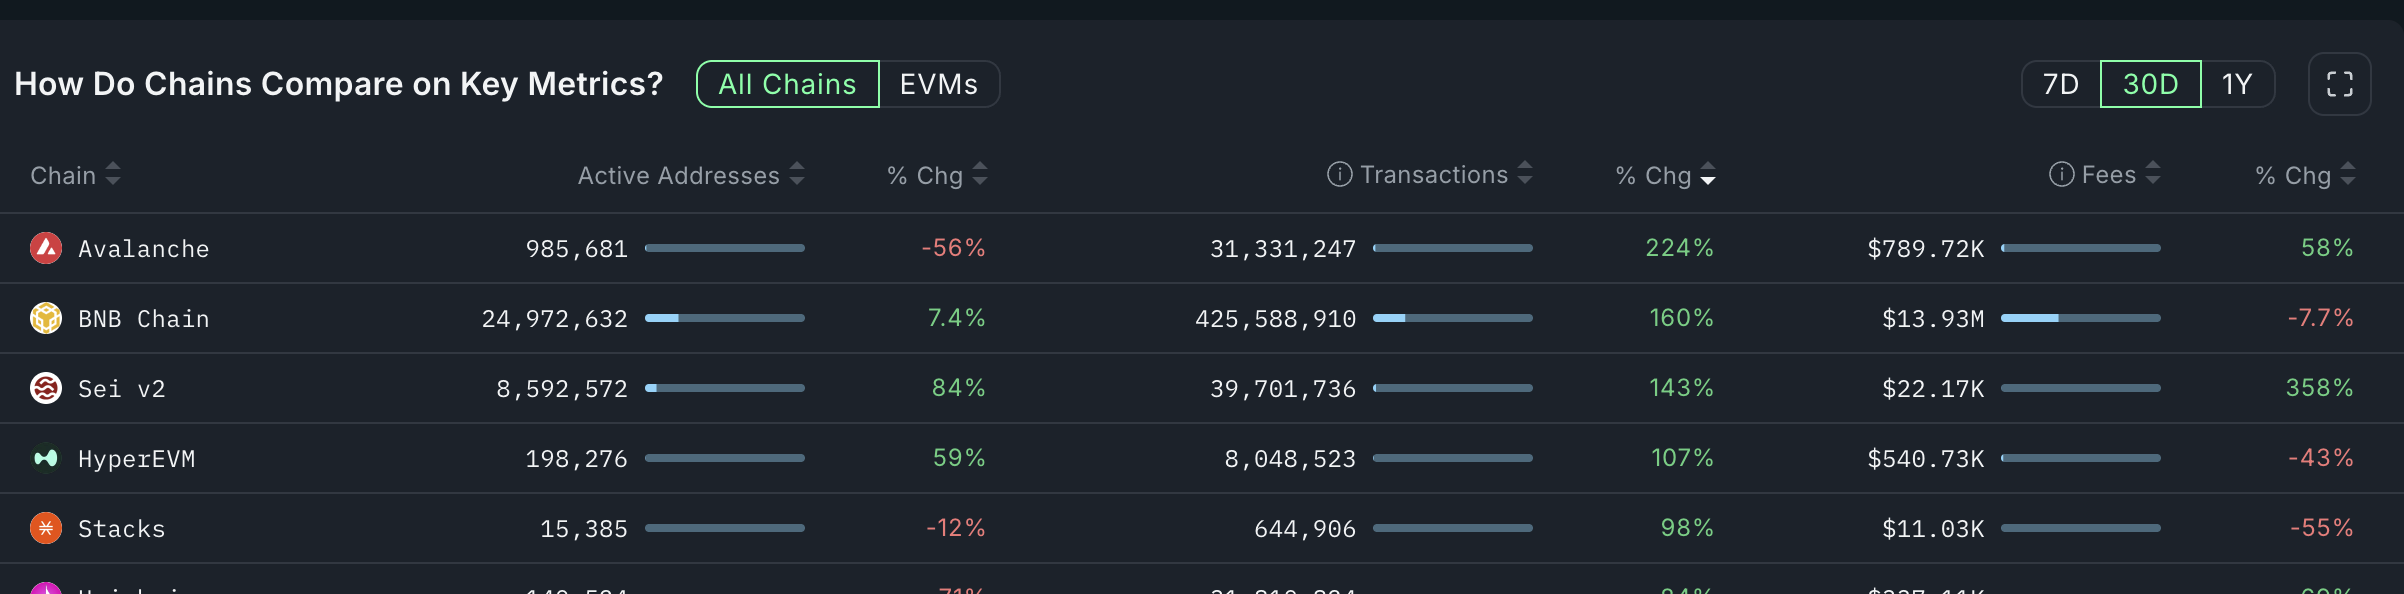 BNB active addresses chart | Source: Nansen
Additional data shows BNB Chain is now the largest player in the decentralized exchange sector. Protocols in its network handled over $166 billion in June, a record high. It was a big increase from last month’s $104 billion, and was higher than Solana (SOL) and ethereum combined.
BNB Chain is also seeing rapid growth in stablecoin activity. Its total stablecoin supply rose by 2.3% in June to $10.5 billion, while the number of unique stablecoin-holding addresses grew 13% to 12 million. Adjusted stablecoin transaction volume on the network topped $340 billion for the month.
Meanwhile, BNB Chain rolled out its Maxwell upgrade, aimed at boosting network speed to 75 seconds per block. It marks the third major upgrade this year, following Pascal, which improved Ethereum compatibility, and Lorentz, which reduced block times from 3 seconds to 1.5 seconds.
BNB price chart analysis
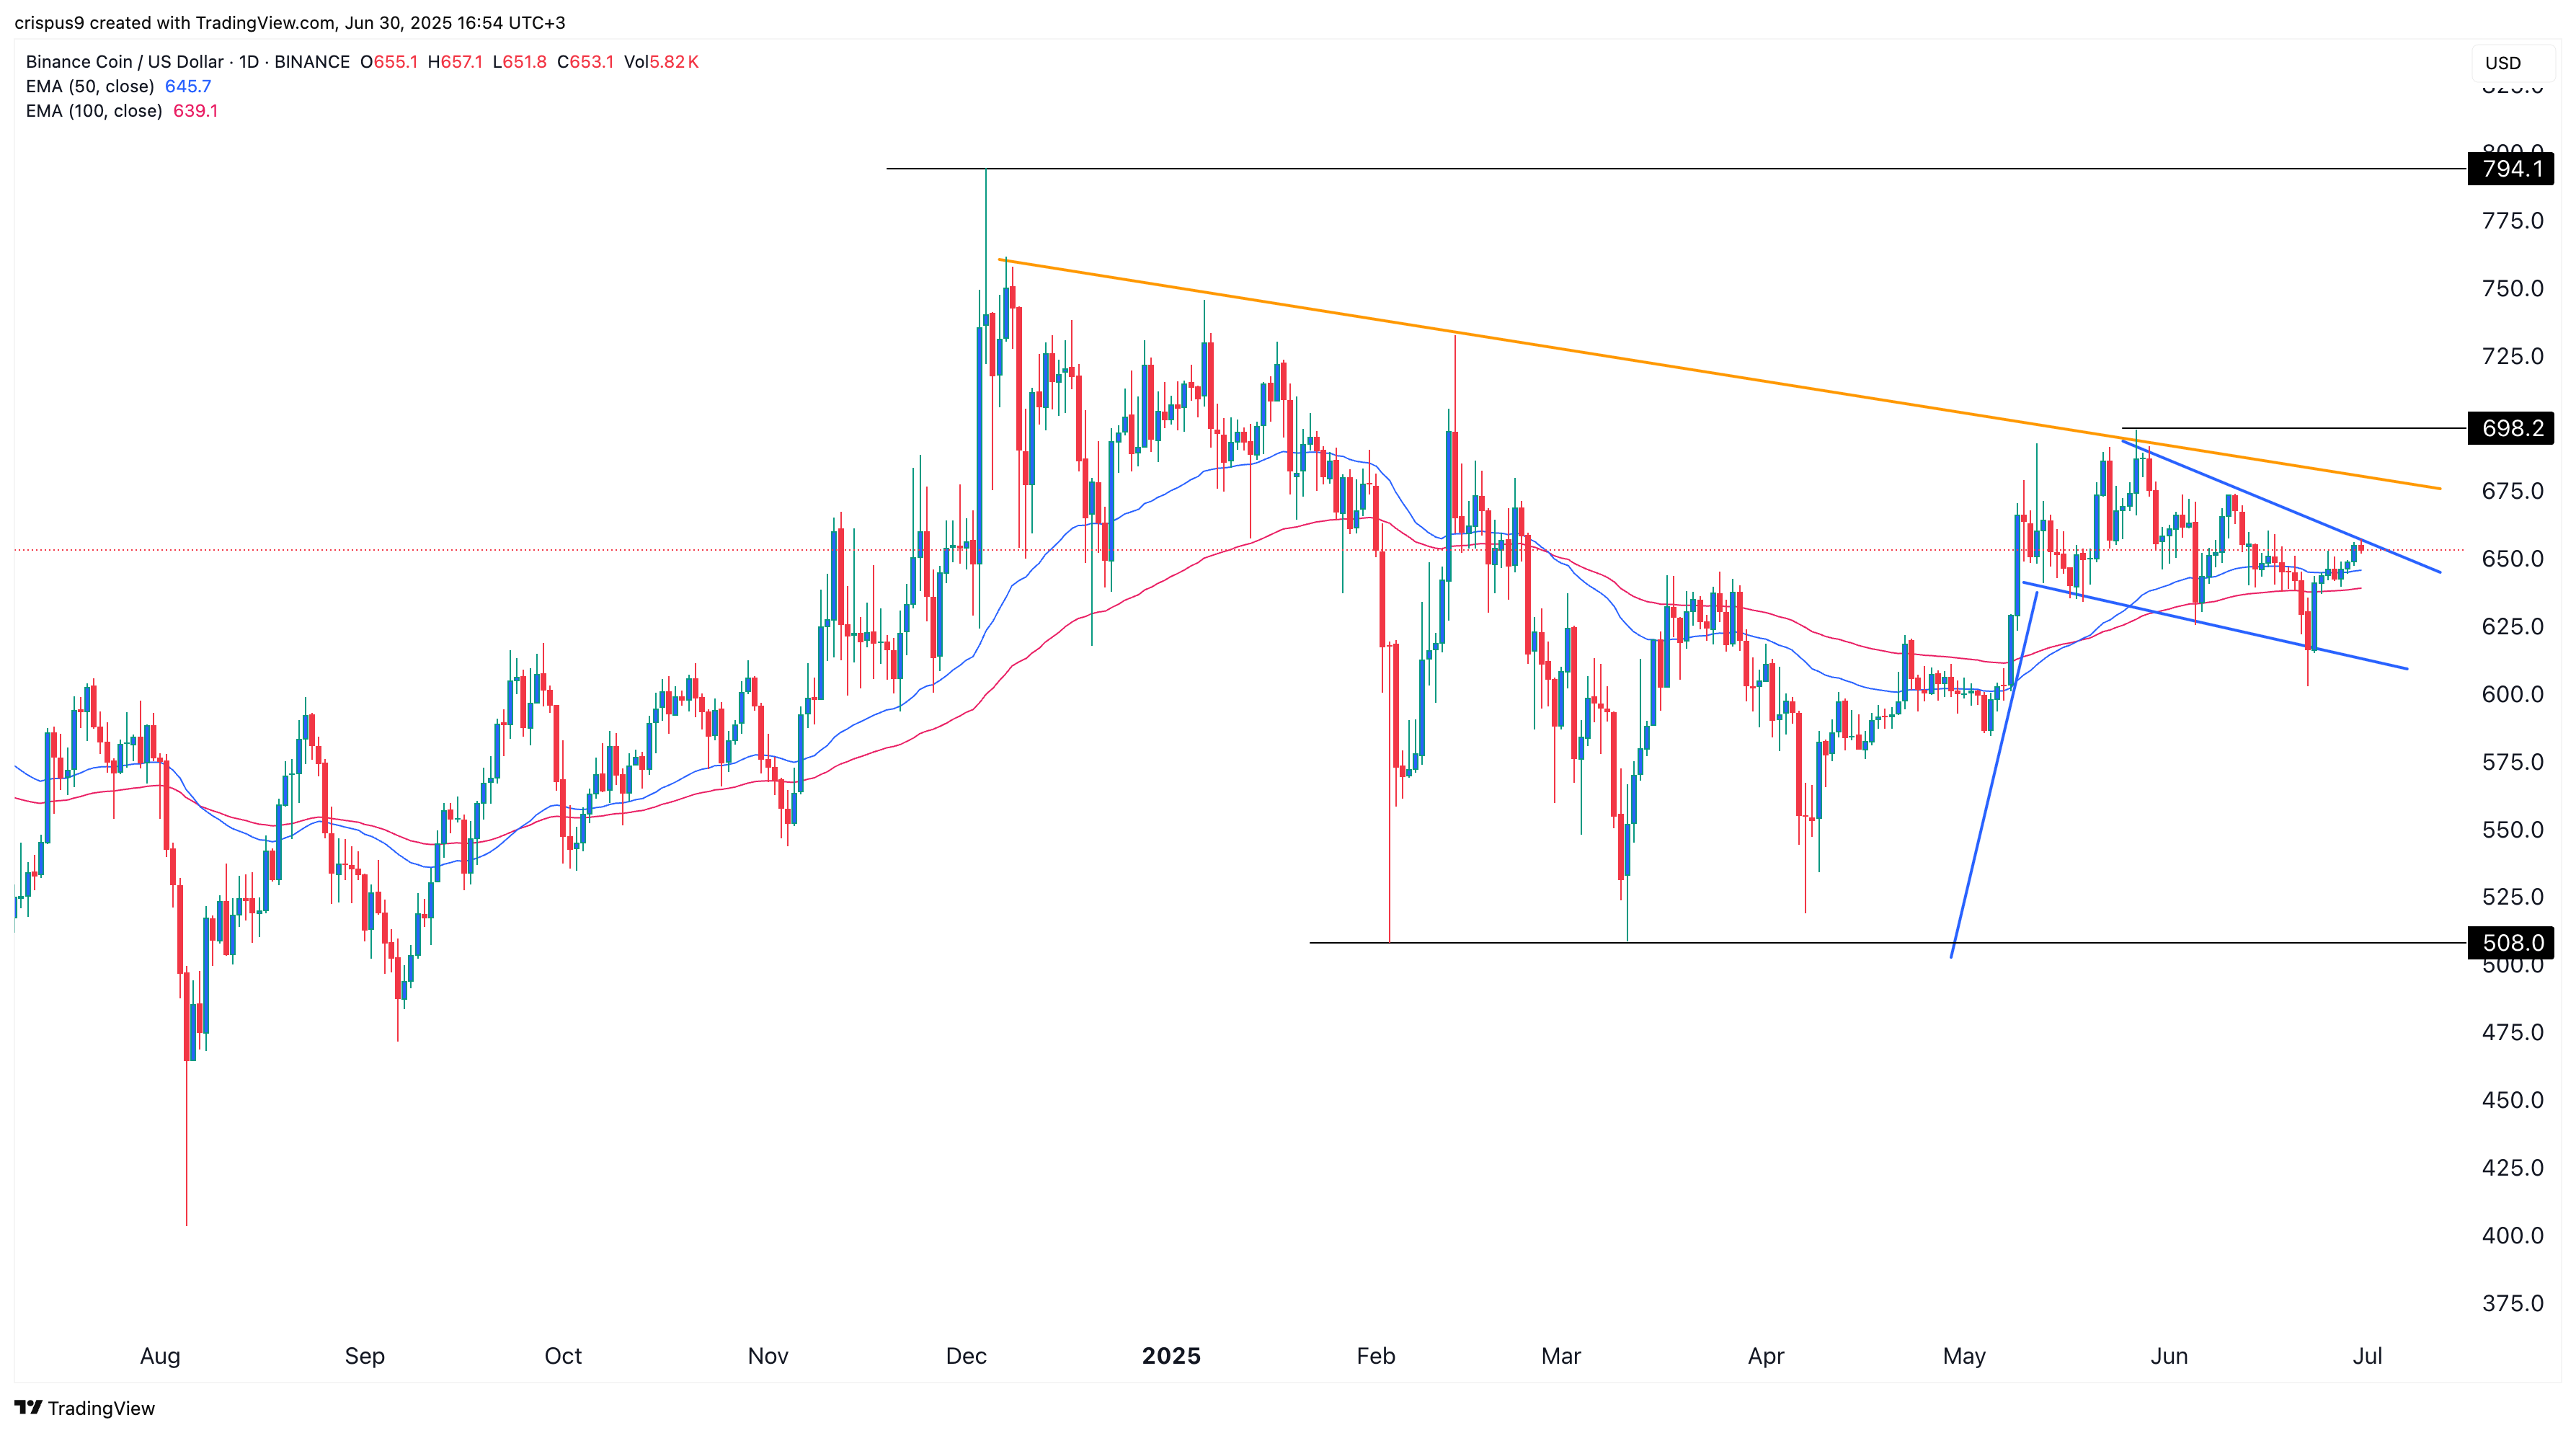
The daily chart shows that BNB bottomed at $508 earlier this year and has since bounced back to $653. The price action has formed a bullish flag pattern, typically seen as one of the most reliable continuation patterns in technical analysis. The setup consists of a sharp vertical rise followed by a descending consolidation channel.
The BNB token has moved above the 50-day and 100-day Exponential Moving Averages. Top oscillators like the Relative Strength Index and the MACD have pointed upwards.
Therefore, the token will likely have a bullish breakout, with the next target being the psychological point at $700, its highest point on May 28. A break above that level will point to more upside, with the next target being at $795.
