LUNC Price Teeters on Edge as Weekly Burn Hits 365M – Risky Pattern Emerges

LUNC's chart flashes warning signals—just as the community incinerates another 365 million tokens this week.
Bulls and bears lock horns
The classic 'hold your breath' formation takes shape while burn metrics scream 'look at me!'—typical crypto theater where supply shocks battle technical gravity.
Tokenomics vs. TA
Deflationary mechanics keep doing their slow burn (literally), but that textbook descending triangle? That's the kind of pattern that makes traders reach for the antacids.
Wall Street would call this 'interesting' while quietly shorting it—but in crypto, we just YOLO and post memes.
LUNC price technical analysis
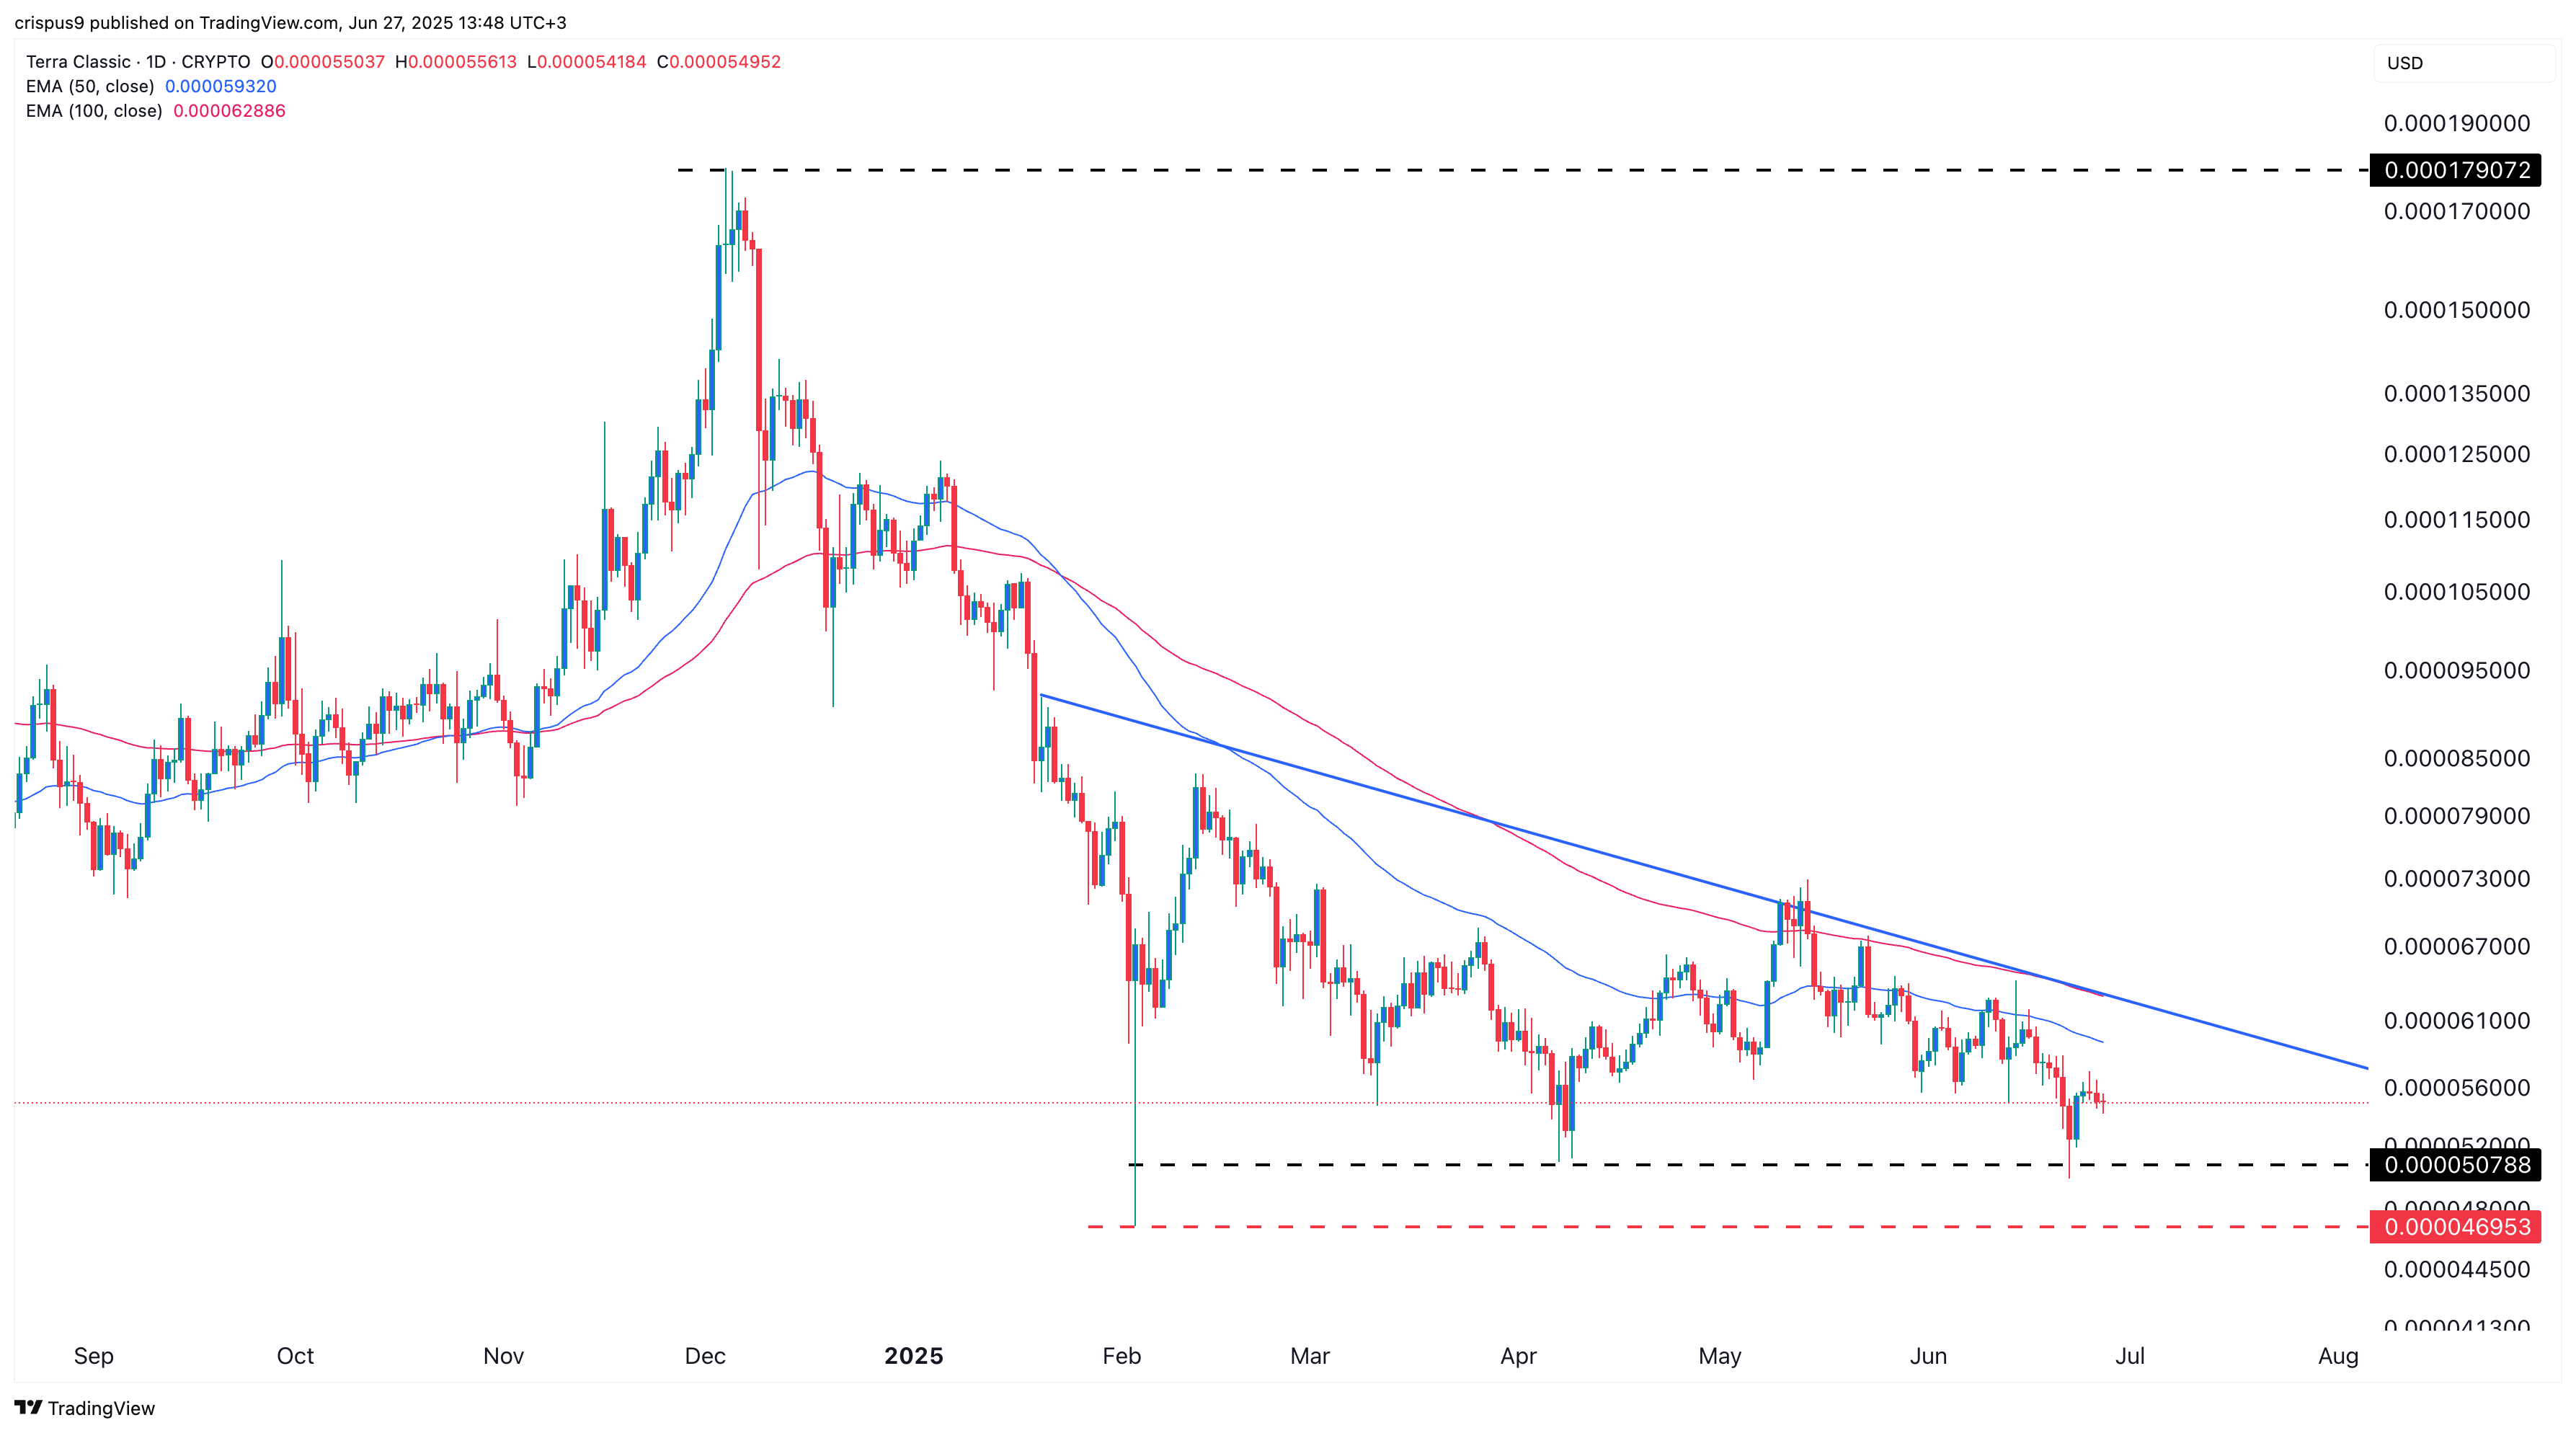
The daily chart shows that LUNC has crashed this year, falling from a high of $0.0001790 in November to $0.000050. It has dropped below both the 50-day and 100-day Exponential Moving Averages, a sign that bears are gaining momentum.
Terra Luna Classic has also formed a descending triangle pattern, a commonly bearish continuation signal. This pattern includes a horizontal base, currently around $0.00005078, and a descending trendline connecting lower swing highs since January 19.
Therefore, the token is at risk of a strong bearish breakout, with the initial target at $0.00005078. A drop below that level could open the door to further downside, potentially retesting the year-to-date low of $0.00004695.

Log in to Reply
Log in to comment your thoughtsComments
Related Articles
|Square
Get the BTCC app to start your crypto journey
Get started today Scan to join our 100M+ users