Bitcoin’s Price Chart Screamed Danger Before the Crash—Here’s What You Missed

The signs were there—if you knew where to look. Bitcoin's recent nosedive wasn't some black swan event; the charts telegraphed weakness days before the sell-off. Technical traders saw the writing on the wall while the 'buy the dip' crowd kept stacking sats blindly.
Key indicators flashed red: weakening momentum, failed support levels, and a classic bearish divergence pattern. Yet Wall Street's latest 'crypto experts' somehow missed it—too busy pitching their new Bitcoin ETF over martinis.
This isn't your first rodeo. Markets move in cycles, and Bitcoin's no exception. The real question? Whether you're reading the charts...or just the hype.
Key technical points
- $108,900 Resistance: Rejection from this exact level was predicted, backed by multiple high-confluence indicators
- Liquidity Sweep: Weekend lows were a magnet, drawing price into resting liquidity for a textbook flush
- CME Futures Gap: Gap formed at $103,700 due to futures markets being closed on weekends, not due to lack of trading activity
- Support and Resistance: $98,174 weekend low and $101,455 reclaim are key zones for short-term structure
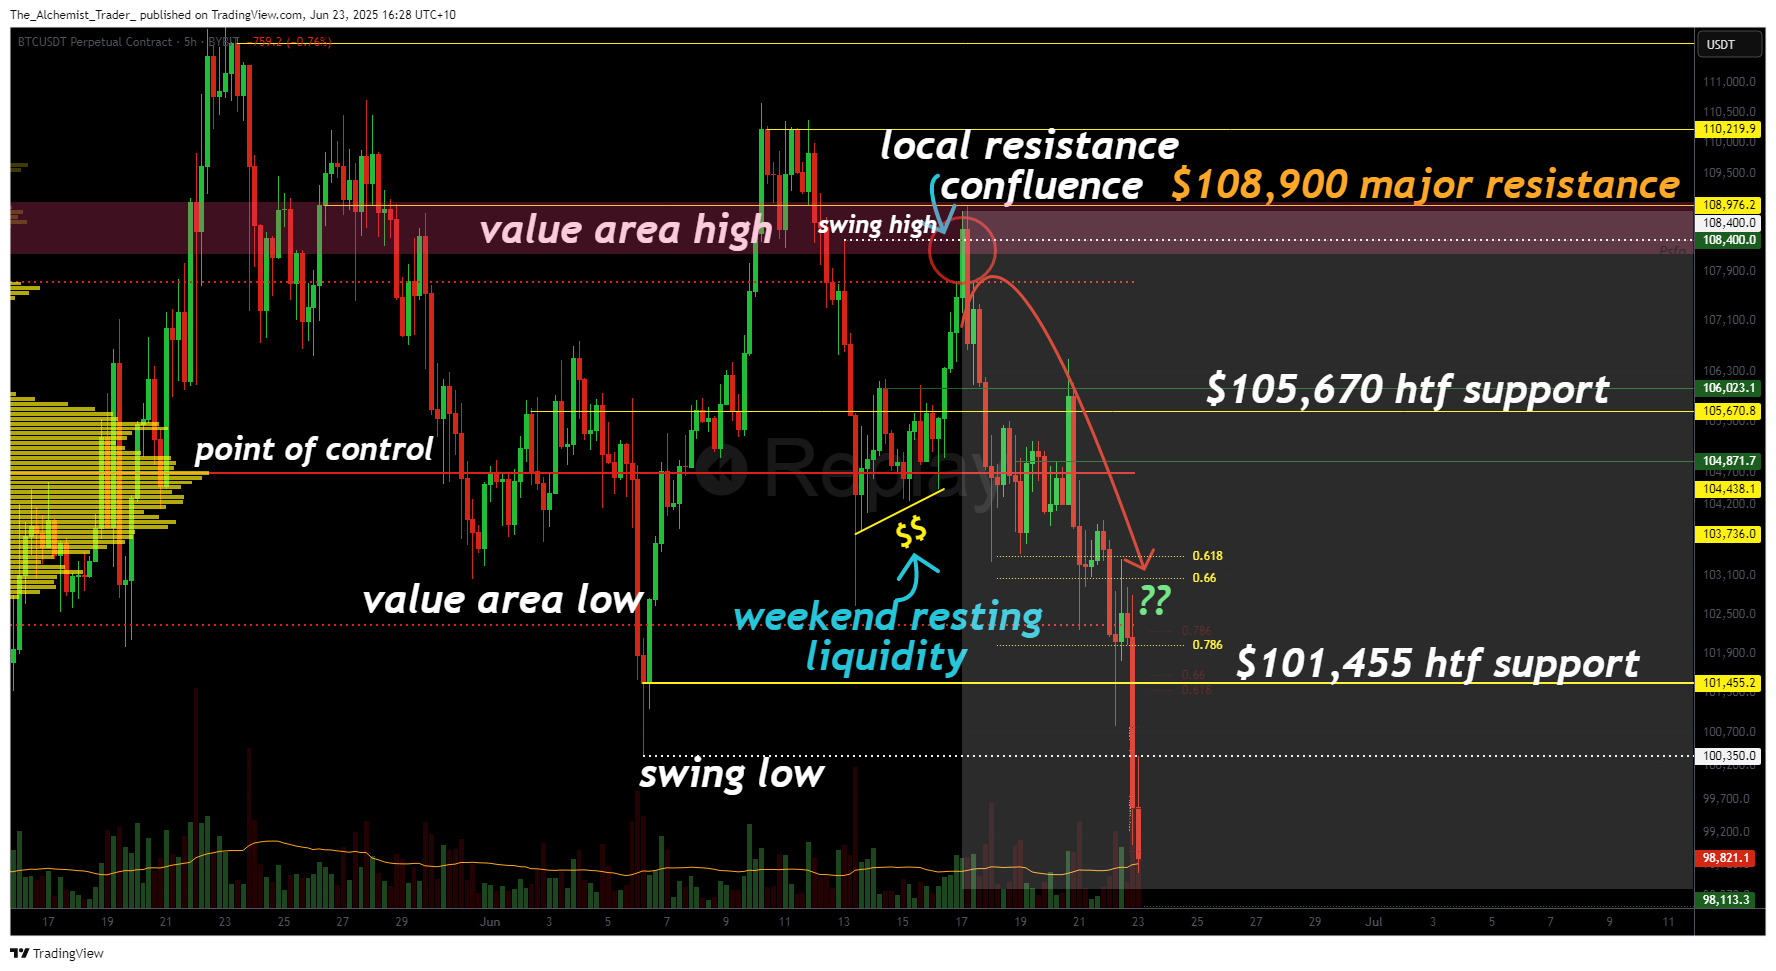
The zone discussed in the prior analysis combined multiple bearish signals: the value area high, macro resistance, the 0.618 Fibonacci retracement, and an untested bearish order block. The rejection occurred with pinpoint accuracy, triggering a sharp sell-off that swept weekend liquidity and validated the predictive power of technical confluence.
The breakdown also targeted a known liquidity pocket, taking out lows around $98,174, a region dense with resting orders, the point of control, and the value area low. As expected, price dipped through this zone in a classic liquidity grab before showing a reaction.
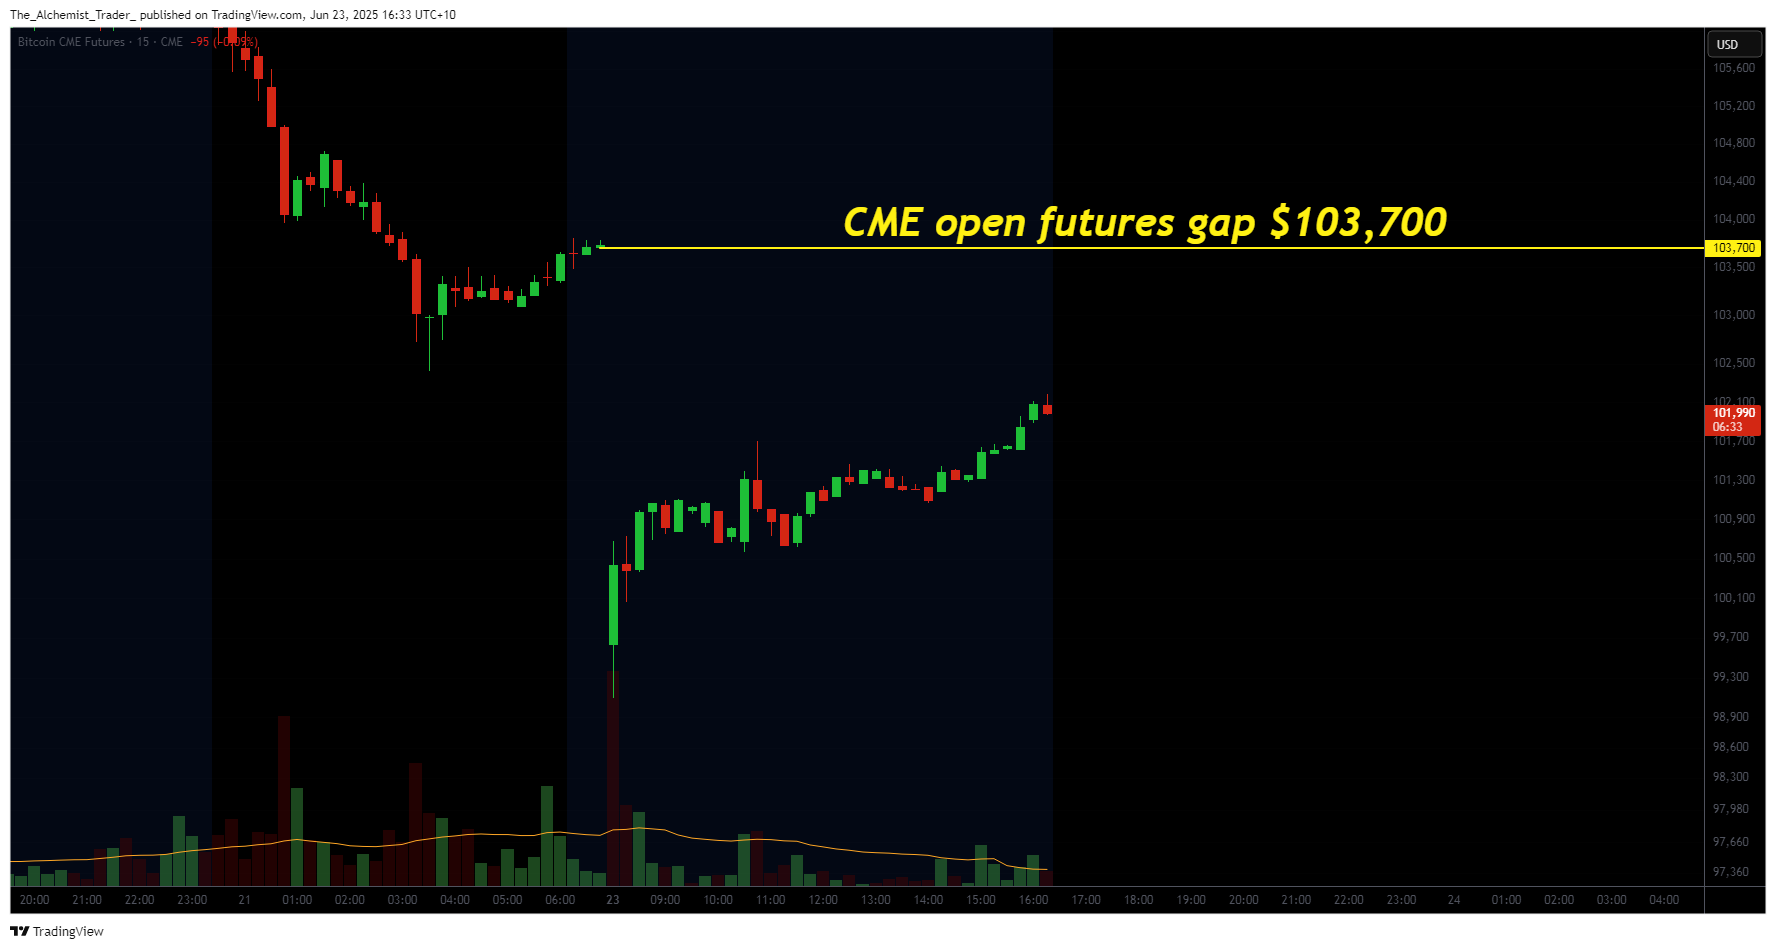
Now, focus shifts to the CME futures gap at $103,700. It’s important to clarify: this gap wasn’t created by low weekend volume, it exists because CME futures do not trade on weekends. When spot markets MOVE while CME is closed, a gap forms that often becomes a high-probability magnet once CME reopens. Historically, over 98% of CME gaps are eventually filled.
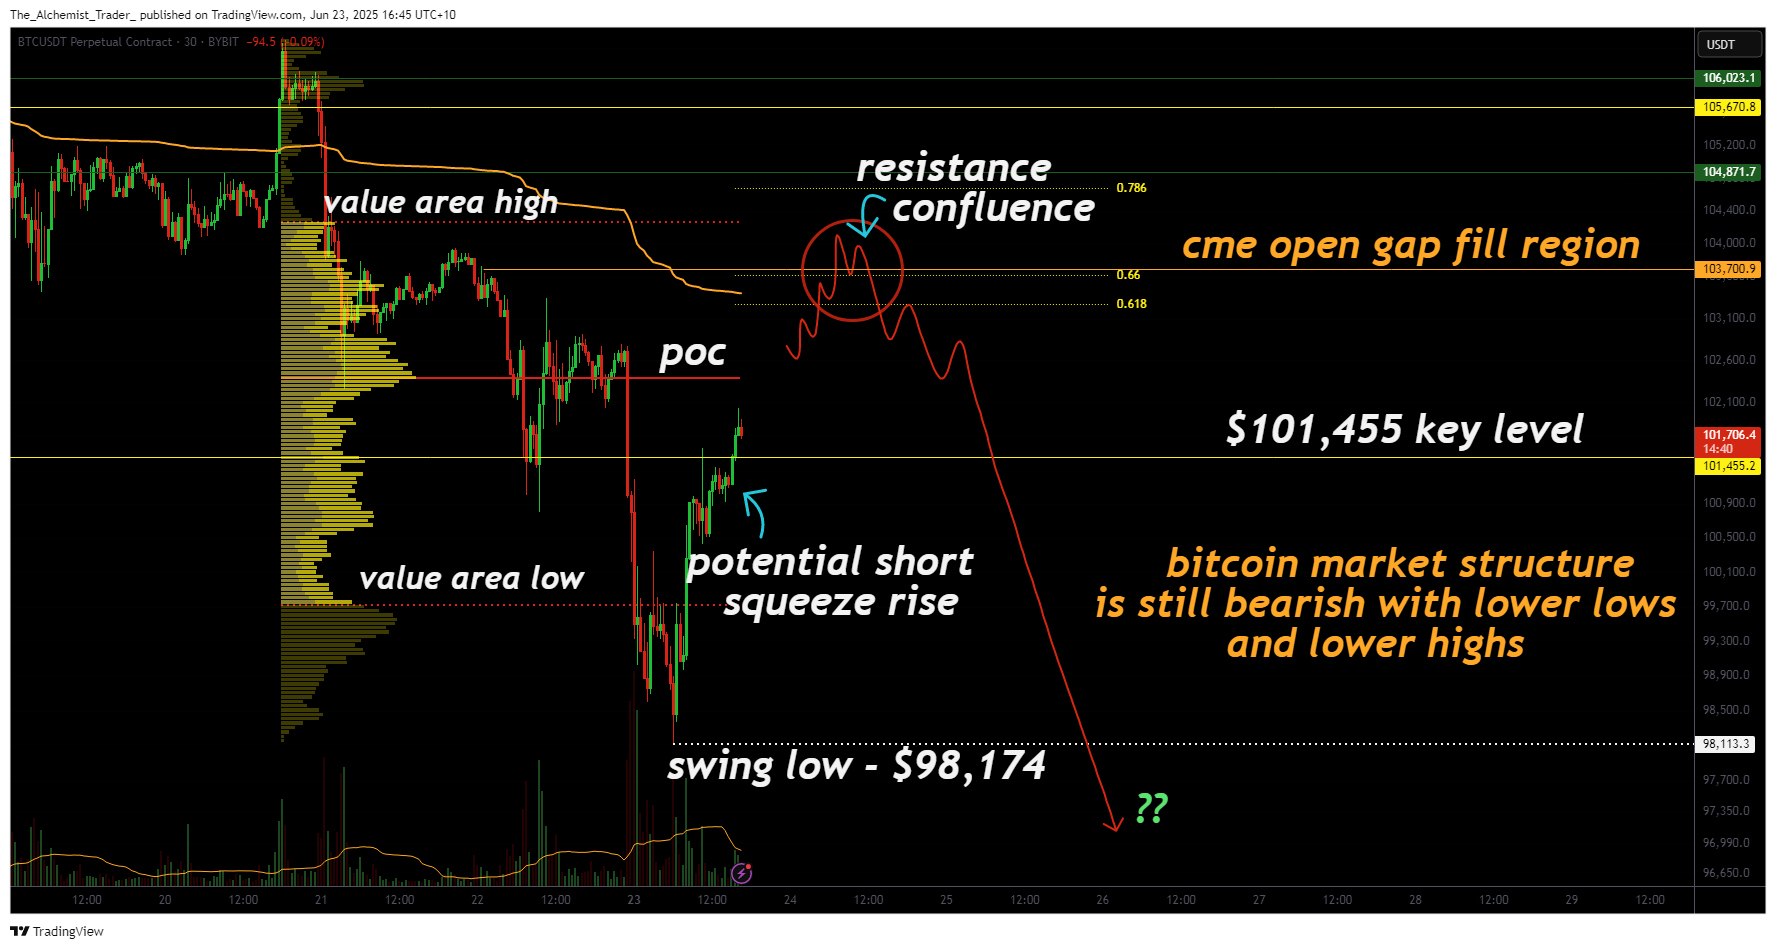
Price has since reclaimed the $101,455 level intraday, increasing the probability of a short squeeze into the CME gap zone. This area also aligns with the VWAP and 0.618 retracement, reinforcing its role as a key decision point. However, if price stalls or rejects here without strong volume follow-through, the move is likely to fade and resume the bearish structure.
Currently, Bitcoin remains structurally bearish. No confirmed higher high or higher low has formed. A failure to hold above the CME gap zone could trigger another leg lower, potentially retesting or breaking below the $98,174 low.
What to expect in the coming price action
Watch closely as bitcoin approaches the $103,700 CME gap. If the gap is filled and price consolidates with weak or indecisive momentum, it could serve as the next rejection zone. A rejection here would reinforce the broader bearish trend and could trigger another wave of selling. Until the structure decisively shifts bullish, the technicals suggest caution remains warranted.

Log in to Reply
Log in to comment your thoughtsComments
Related Articles
|Square
Get the BTCC app to start your crypto journey
Get started today Scan to join our 100M+ users