RAY Price on the Brink: Raydium User Base Crashes 81%—What’s Next?

Raydium's bleeding users might be the canary in the coal mine for RAY's valuation.
Active wallets nosedive—liquidity follows?
When DeFi platforms lose users this fast, it's not a dip—it's an exodus. The usual suspects? High fees, smarter competitors, or just crypto's infamous short attention span. Either way, RAY holders are sweating.
Funny how 'decentralized' finance still dances to the tune of user numbers—almost like a bank, but with more memes.
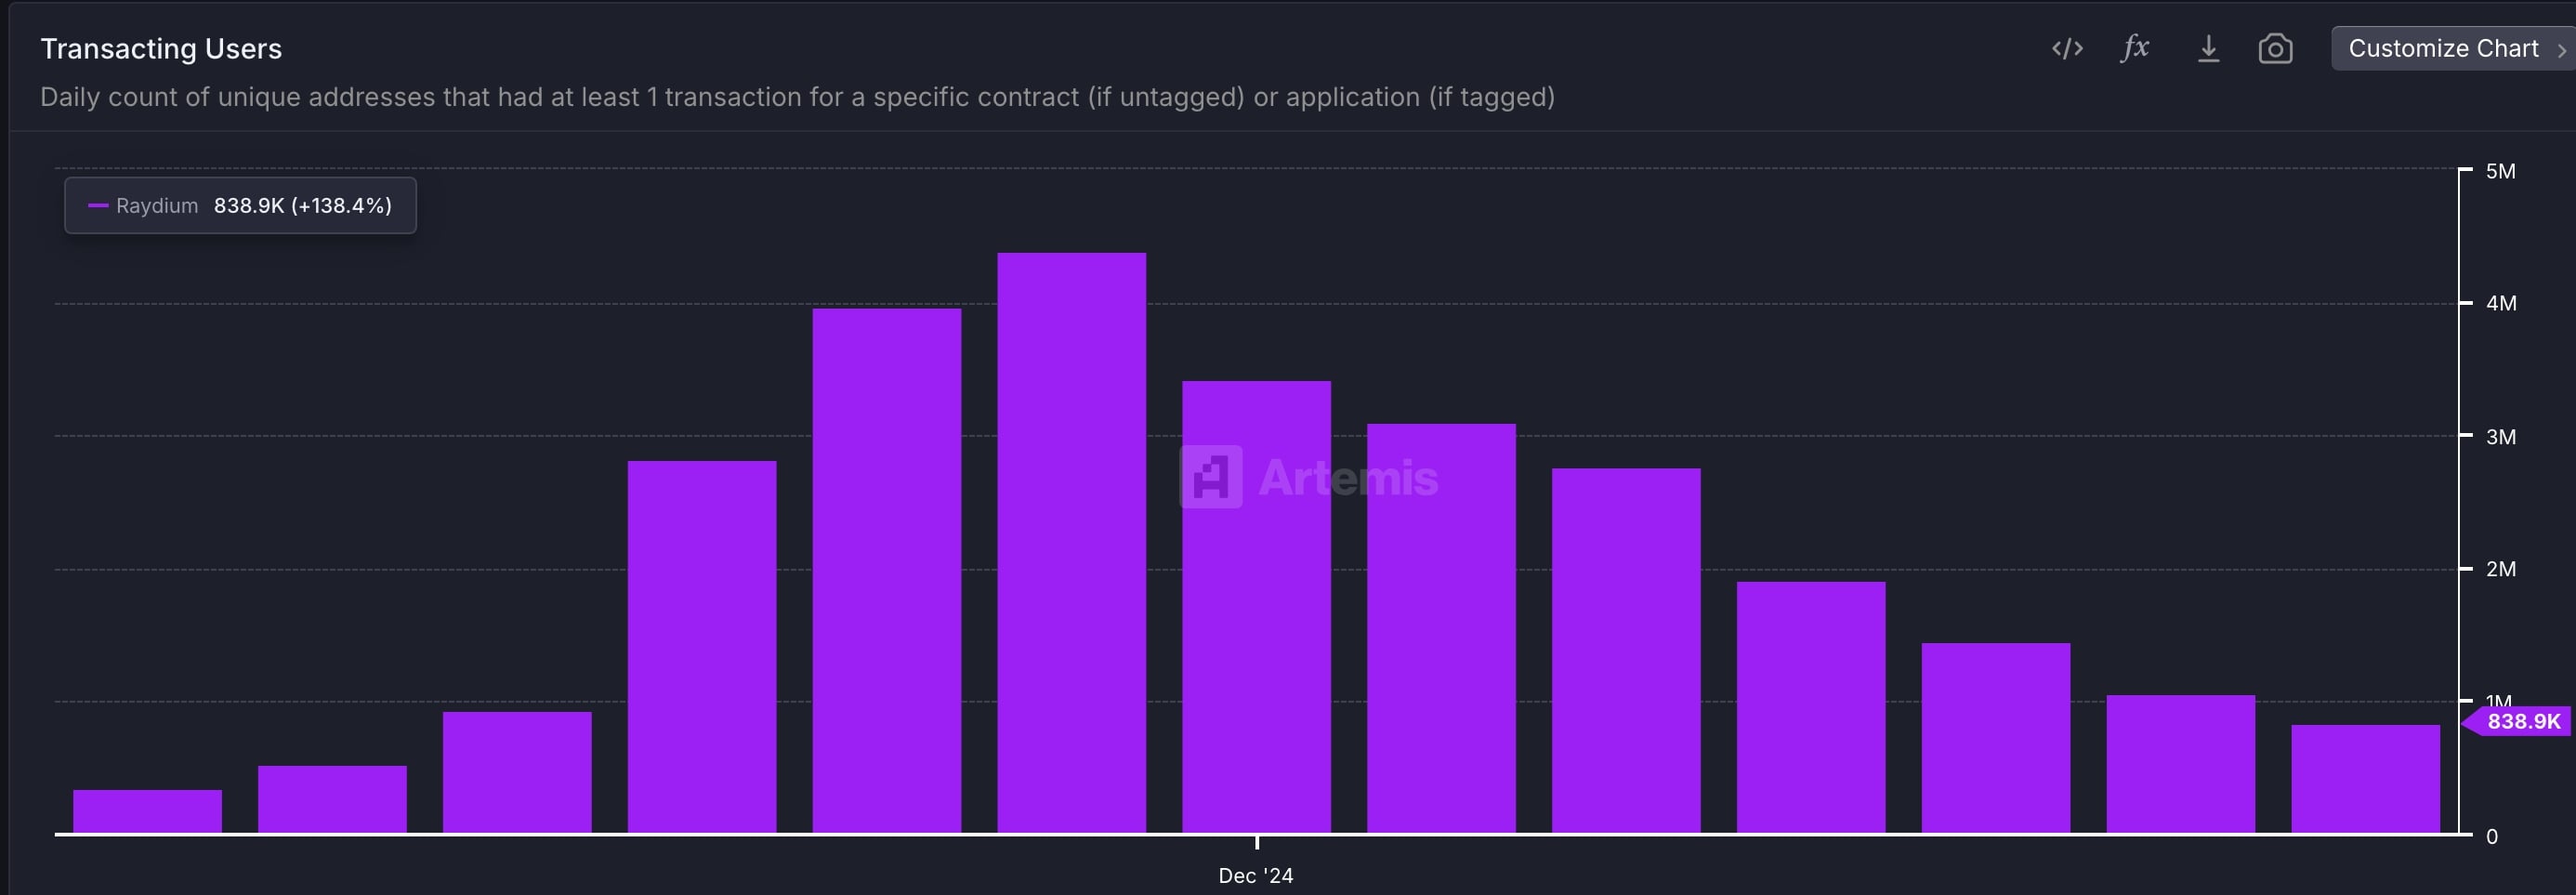 Raydium transacting users | Source: Artemis
Additional data shows that Raydium has lost market share in the DEX industry. According to DeFi Llama, its network processed transactions worth over $21.9 billion in the past 30 days, far below PancakeSwap’s $138 billion and Uniswap’s $95 billion.
By comparison, the platform’s daily volume of $467 million trails other DEX networks such as PancakeSwap, Uniswap, Pump, and Aerodrome. Most notably, Raydium’s monthly transaction volume has dropped by 90%, falling from $124 billion in January to just $12 billion this month.
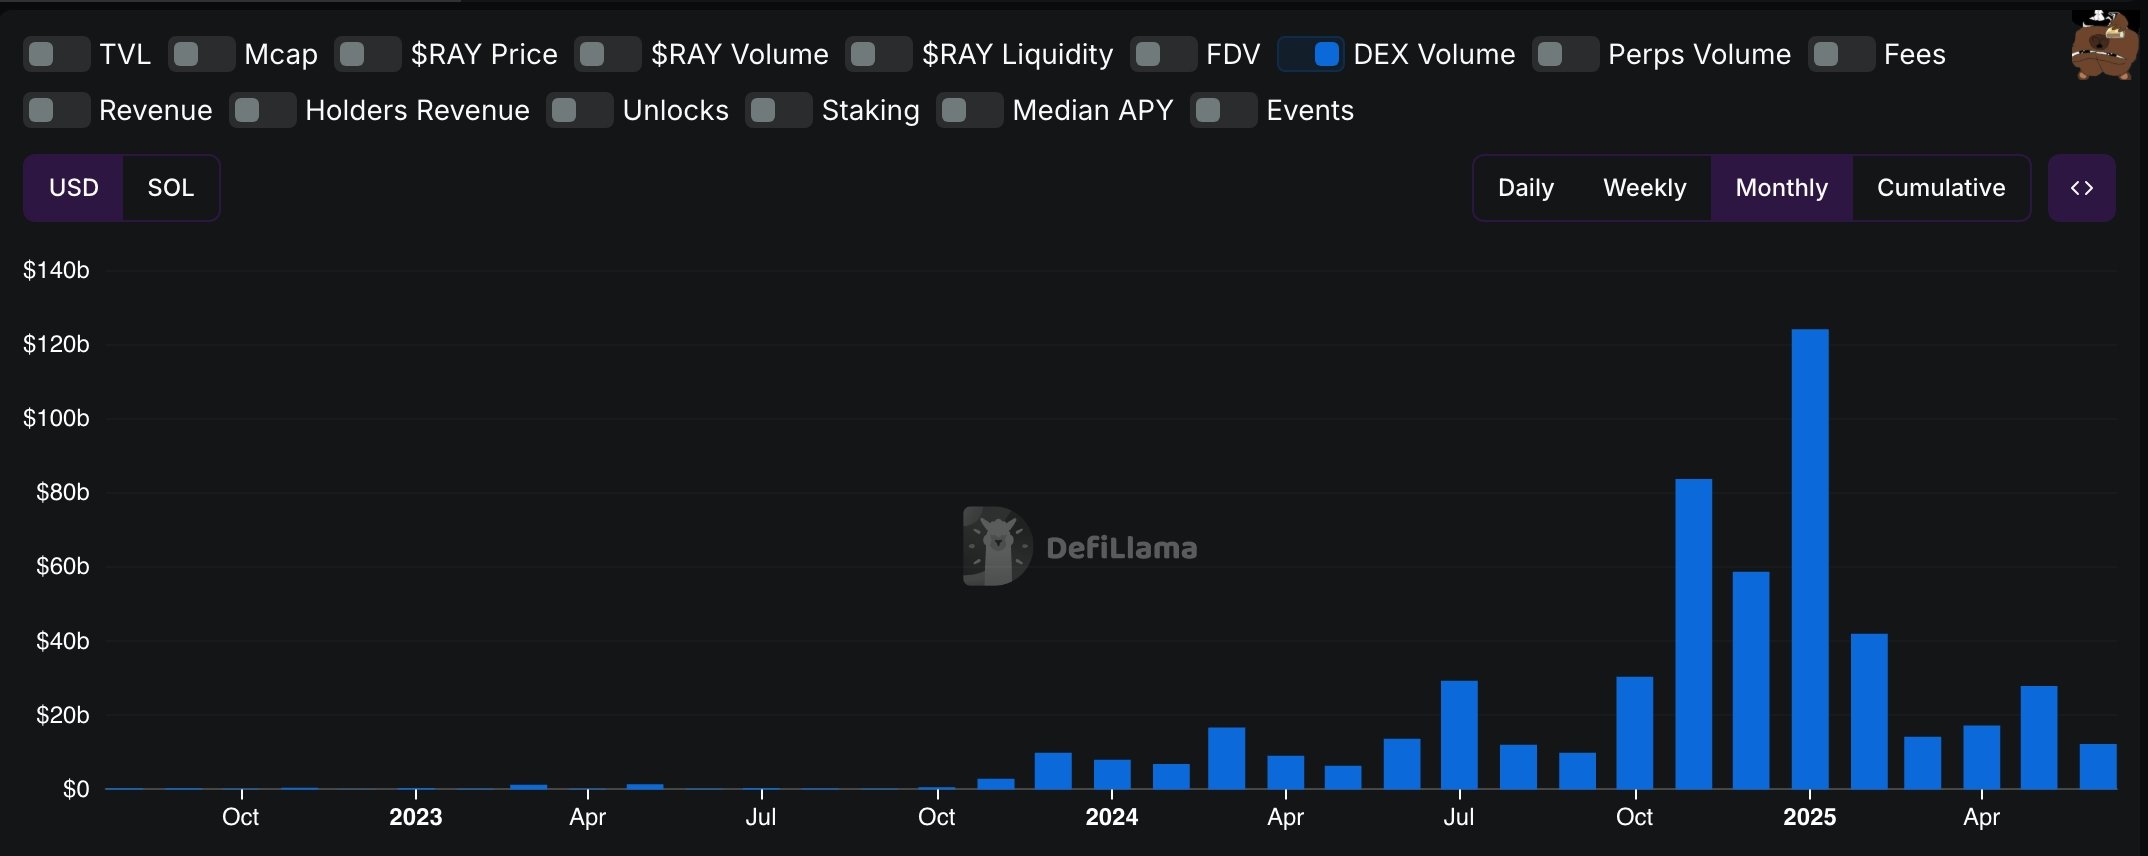
The decline is closely tied to the underperformance of solana (SOL) meme coins. CoinGecko data shows that many of these tokens have plunged more than 15% in the past seven days, pushing their total market cap down to $9.7 billion, a steep drop from $30 billion in January. Raydium typically sees higher volume when these tokens are rallying.
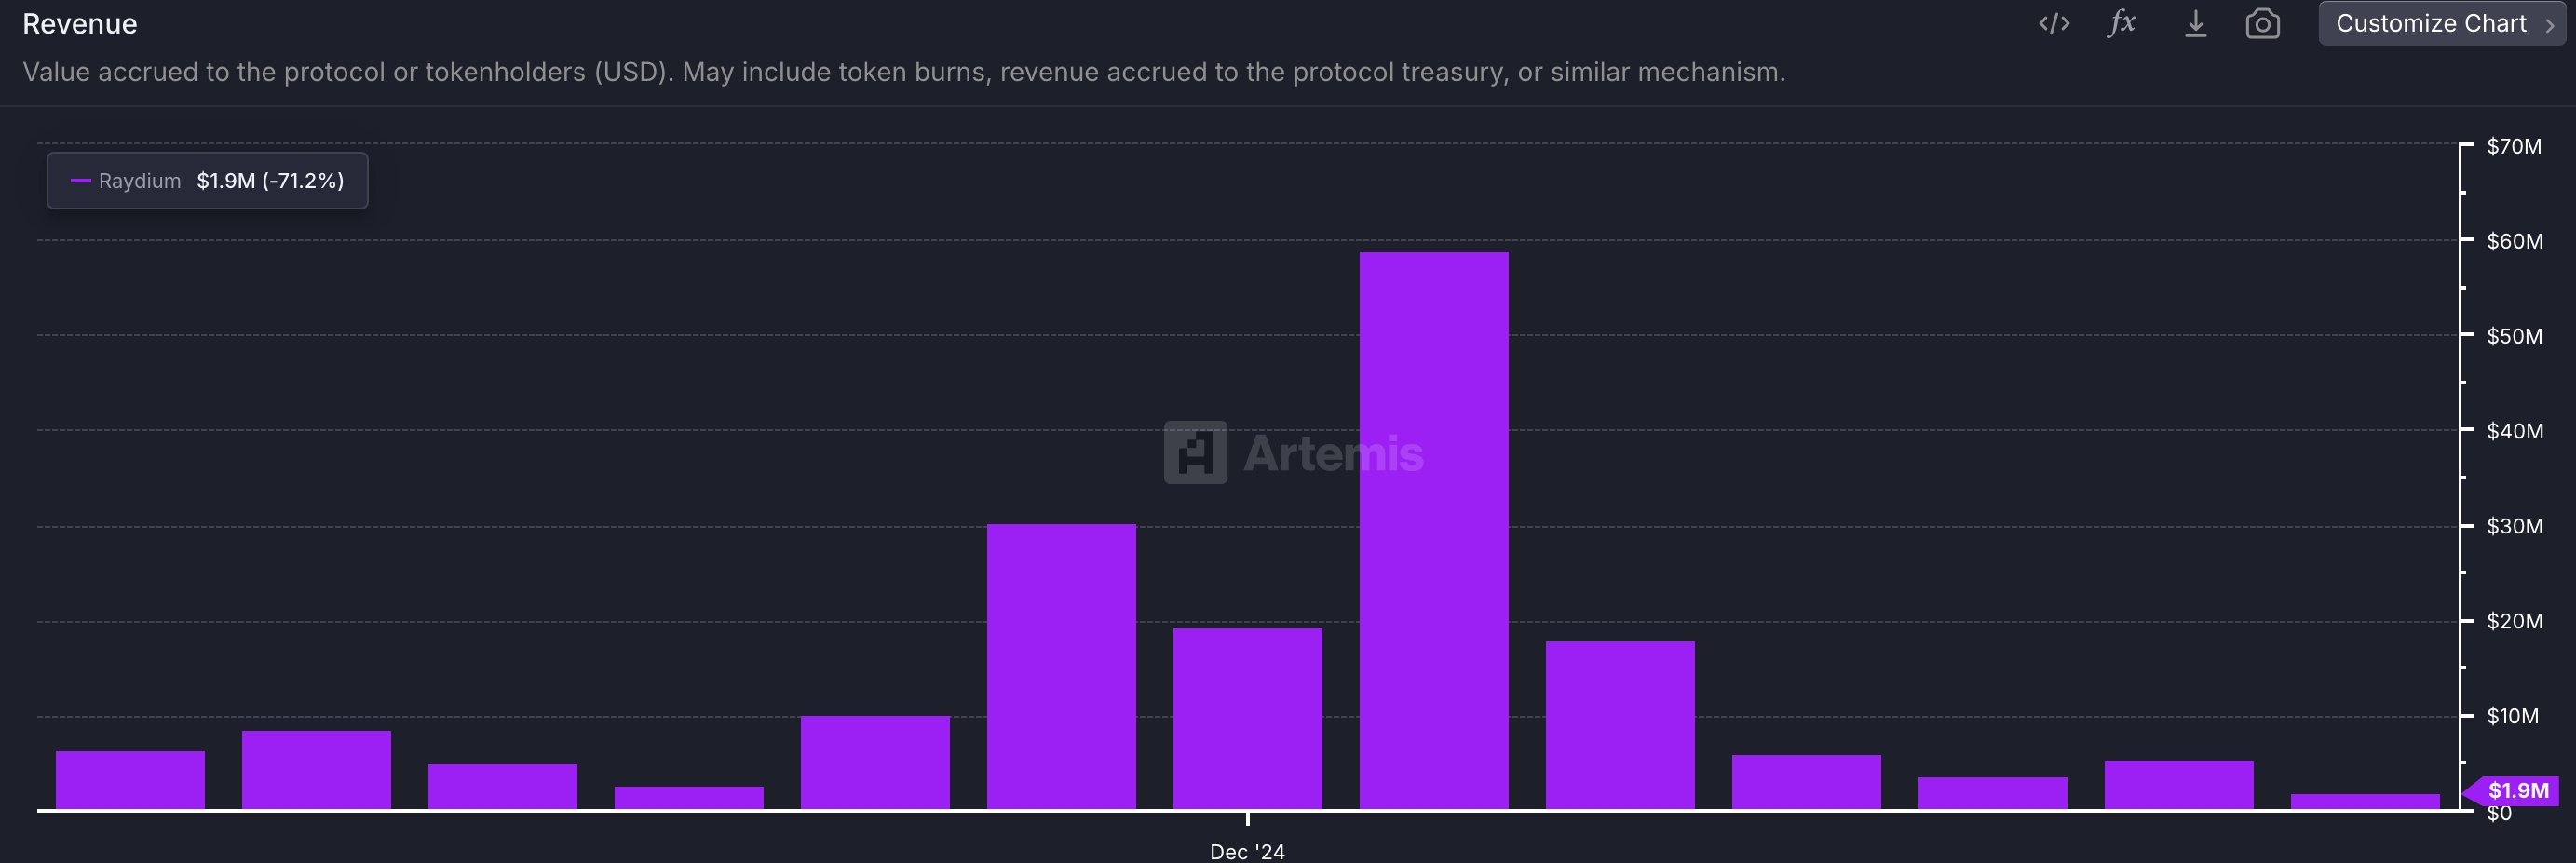
Lower transaction volume has also weighed heavily on Raydium’s revenue, which has plummeted from $58 million in January to $1.9 million this month.
RAY price technical analysis
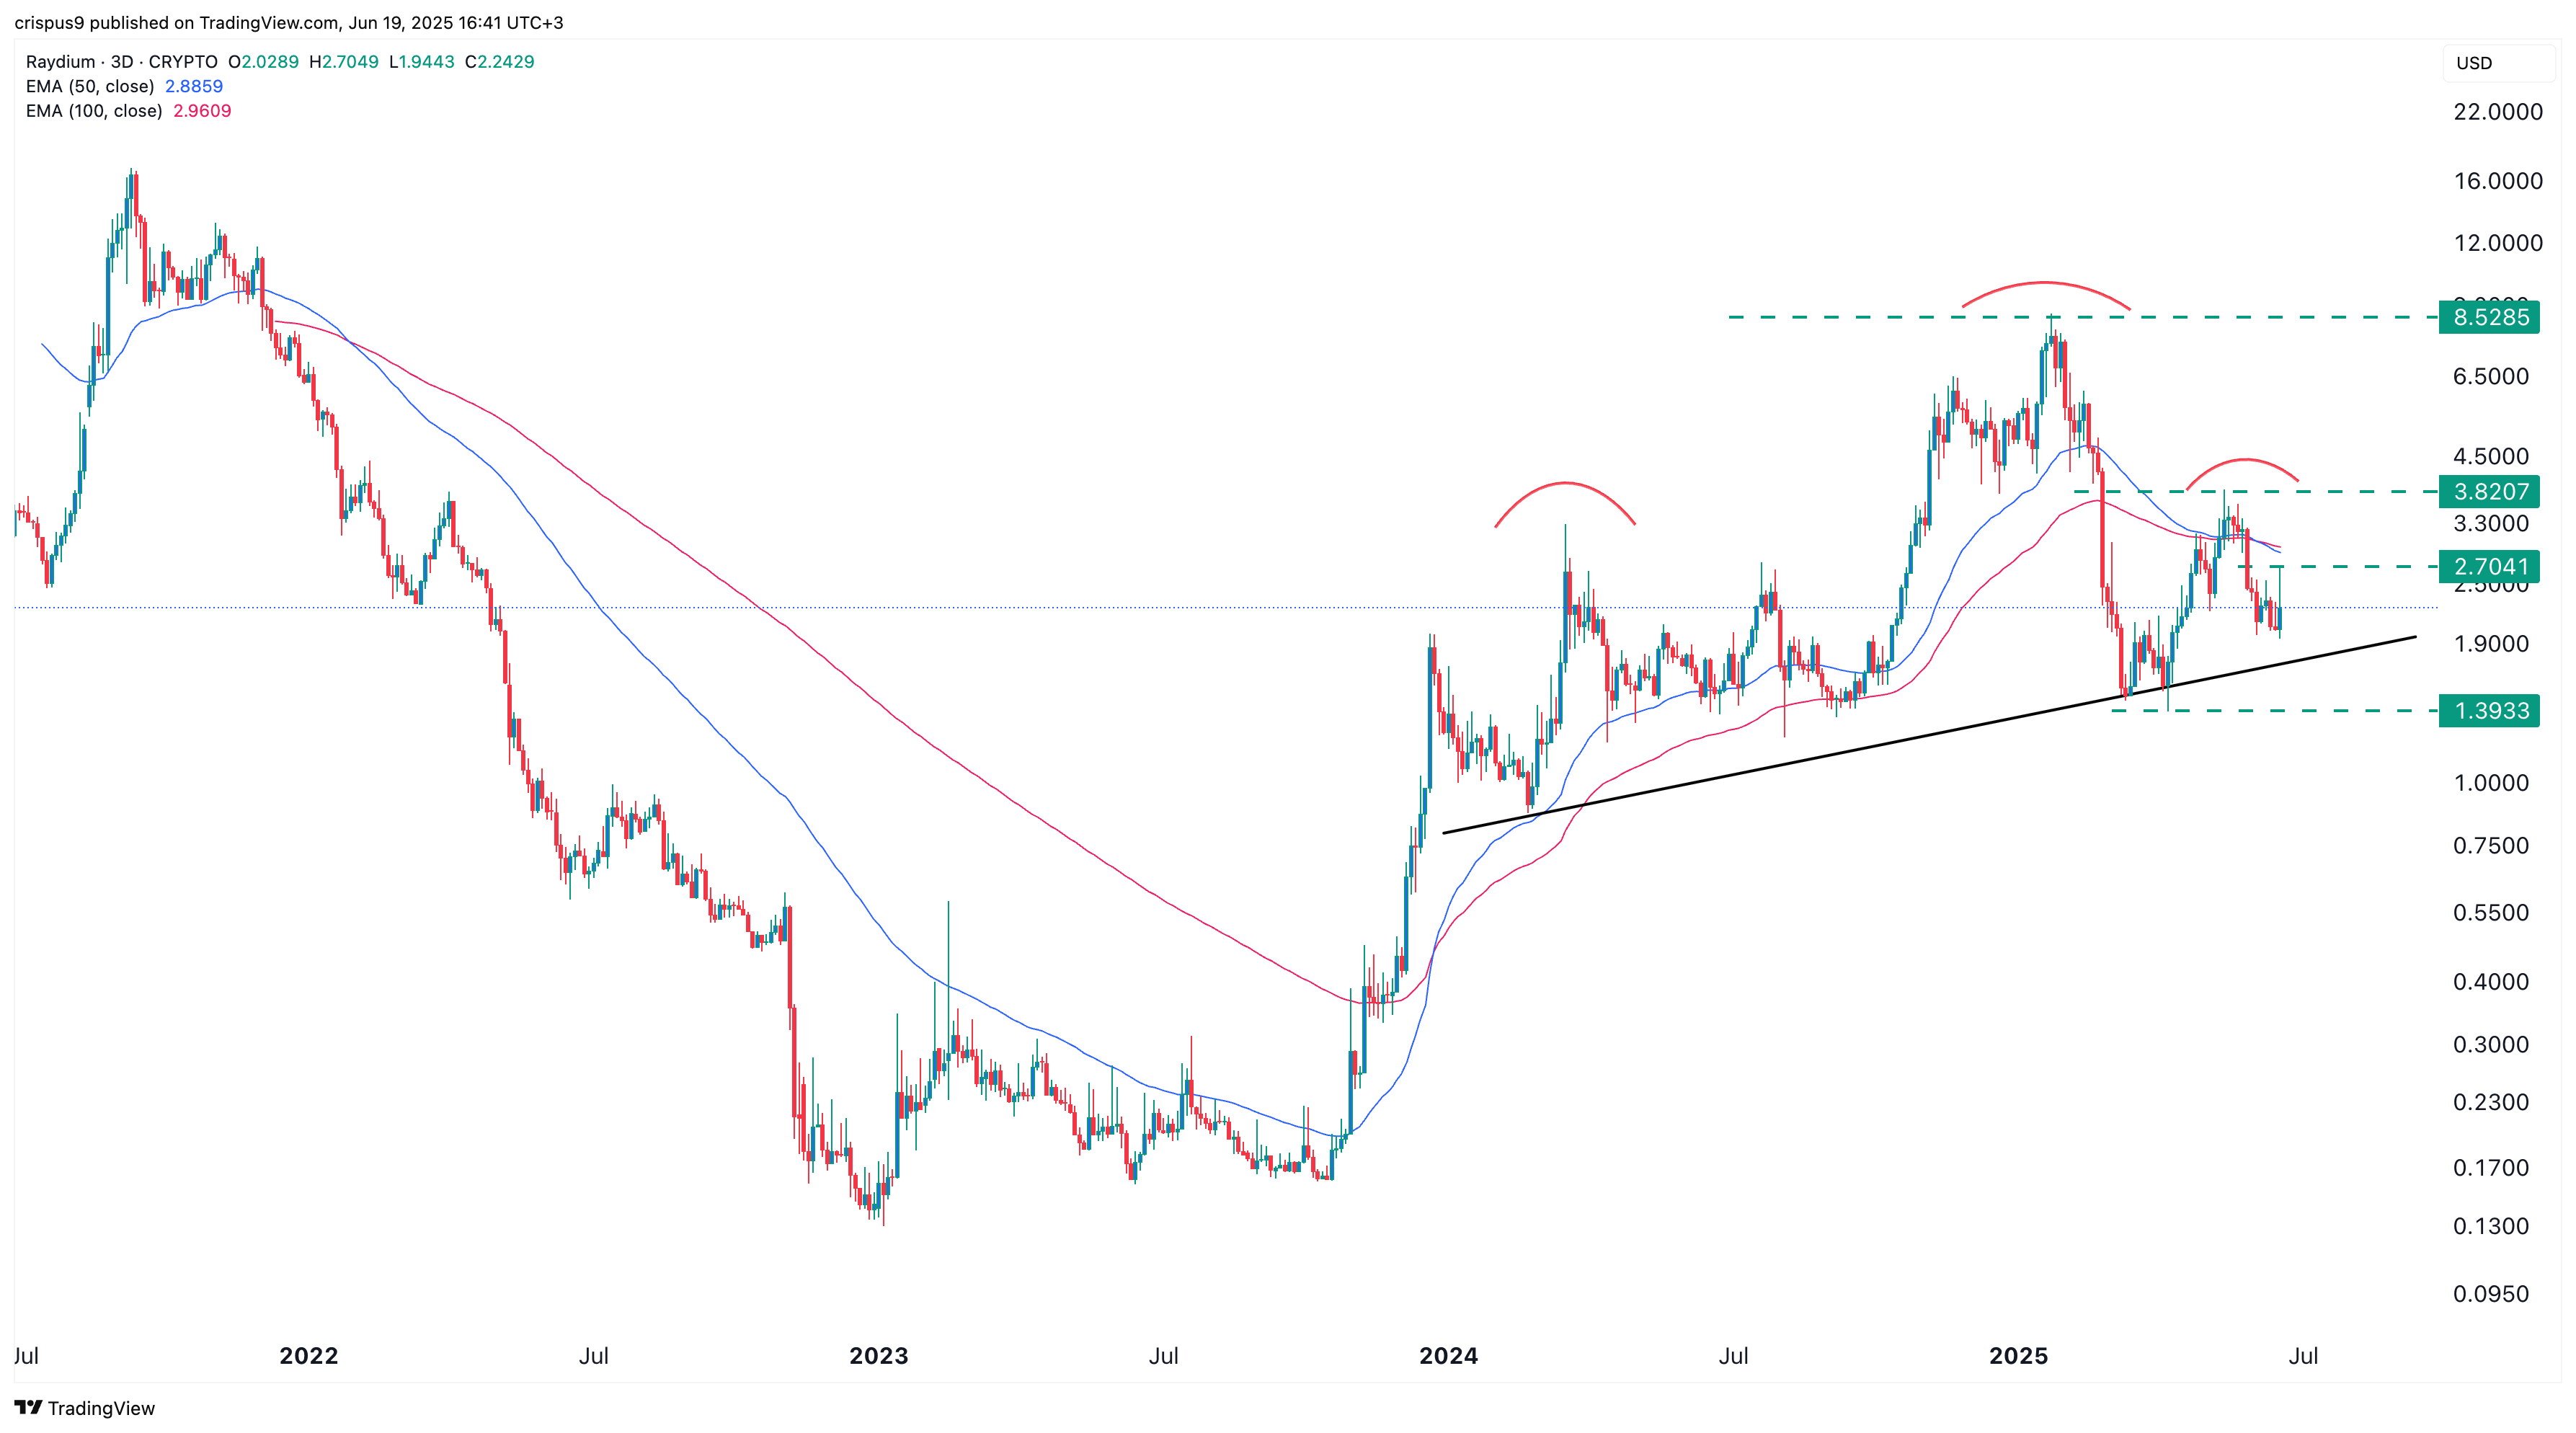
The three-day chart shows that Raydium’s price peaked at $8.5285 in January before pulling back to $2.25. It has since fallen below both the 50-day and 100-day Exponential Moving Averages, which have formed a bearish crossover.
A head-and-shoulders pattern has also emerged, a common bearish reversal signal. Based on this formation, the token could be headed for a breakdown toward $1.40, the April 10 low. However, a move above the right shoulder at $3.820 WOULD invalidate this bearish setup.
