Crypto Bloodbath: Bitcoin & Altcoins Nosedive as Traders Cash Out Gains

Digital assets tumble as market takes profit—because why hold when you can panic-sell?
Bitcoin leads the plunge with altcoins in freefall. Classic crypto volatility or the start of a deeper correction? Traders scramble while institutional players smirk from the sidelines.
Remember: the market always punishes greed... and fear. Now pass the margarita—your portfolio needs a drink.
Bitcoin price chart analysis points to an eventual rebound
Technical indicators suggest that bitcoin may be preparing for another rally, which could spark a broader altcoin rebound. On the daily chart, BTC is gradually forming a bullish flag pattern — characterized by a steep vertical rally (the flagpole) followed by a downward-sloping consolidation channel (the flag). This setup is typically viewed as a continuation pattern.
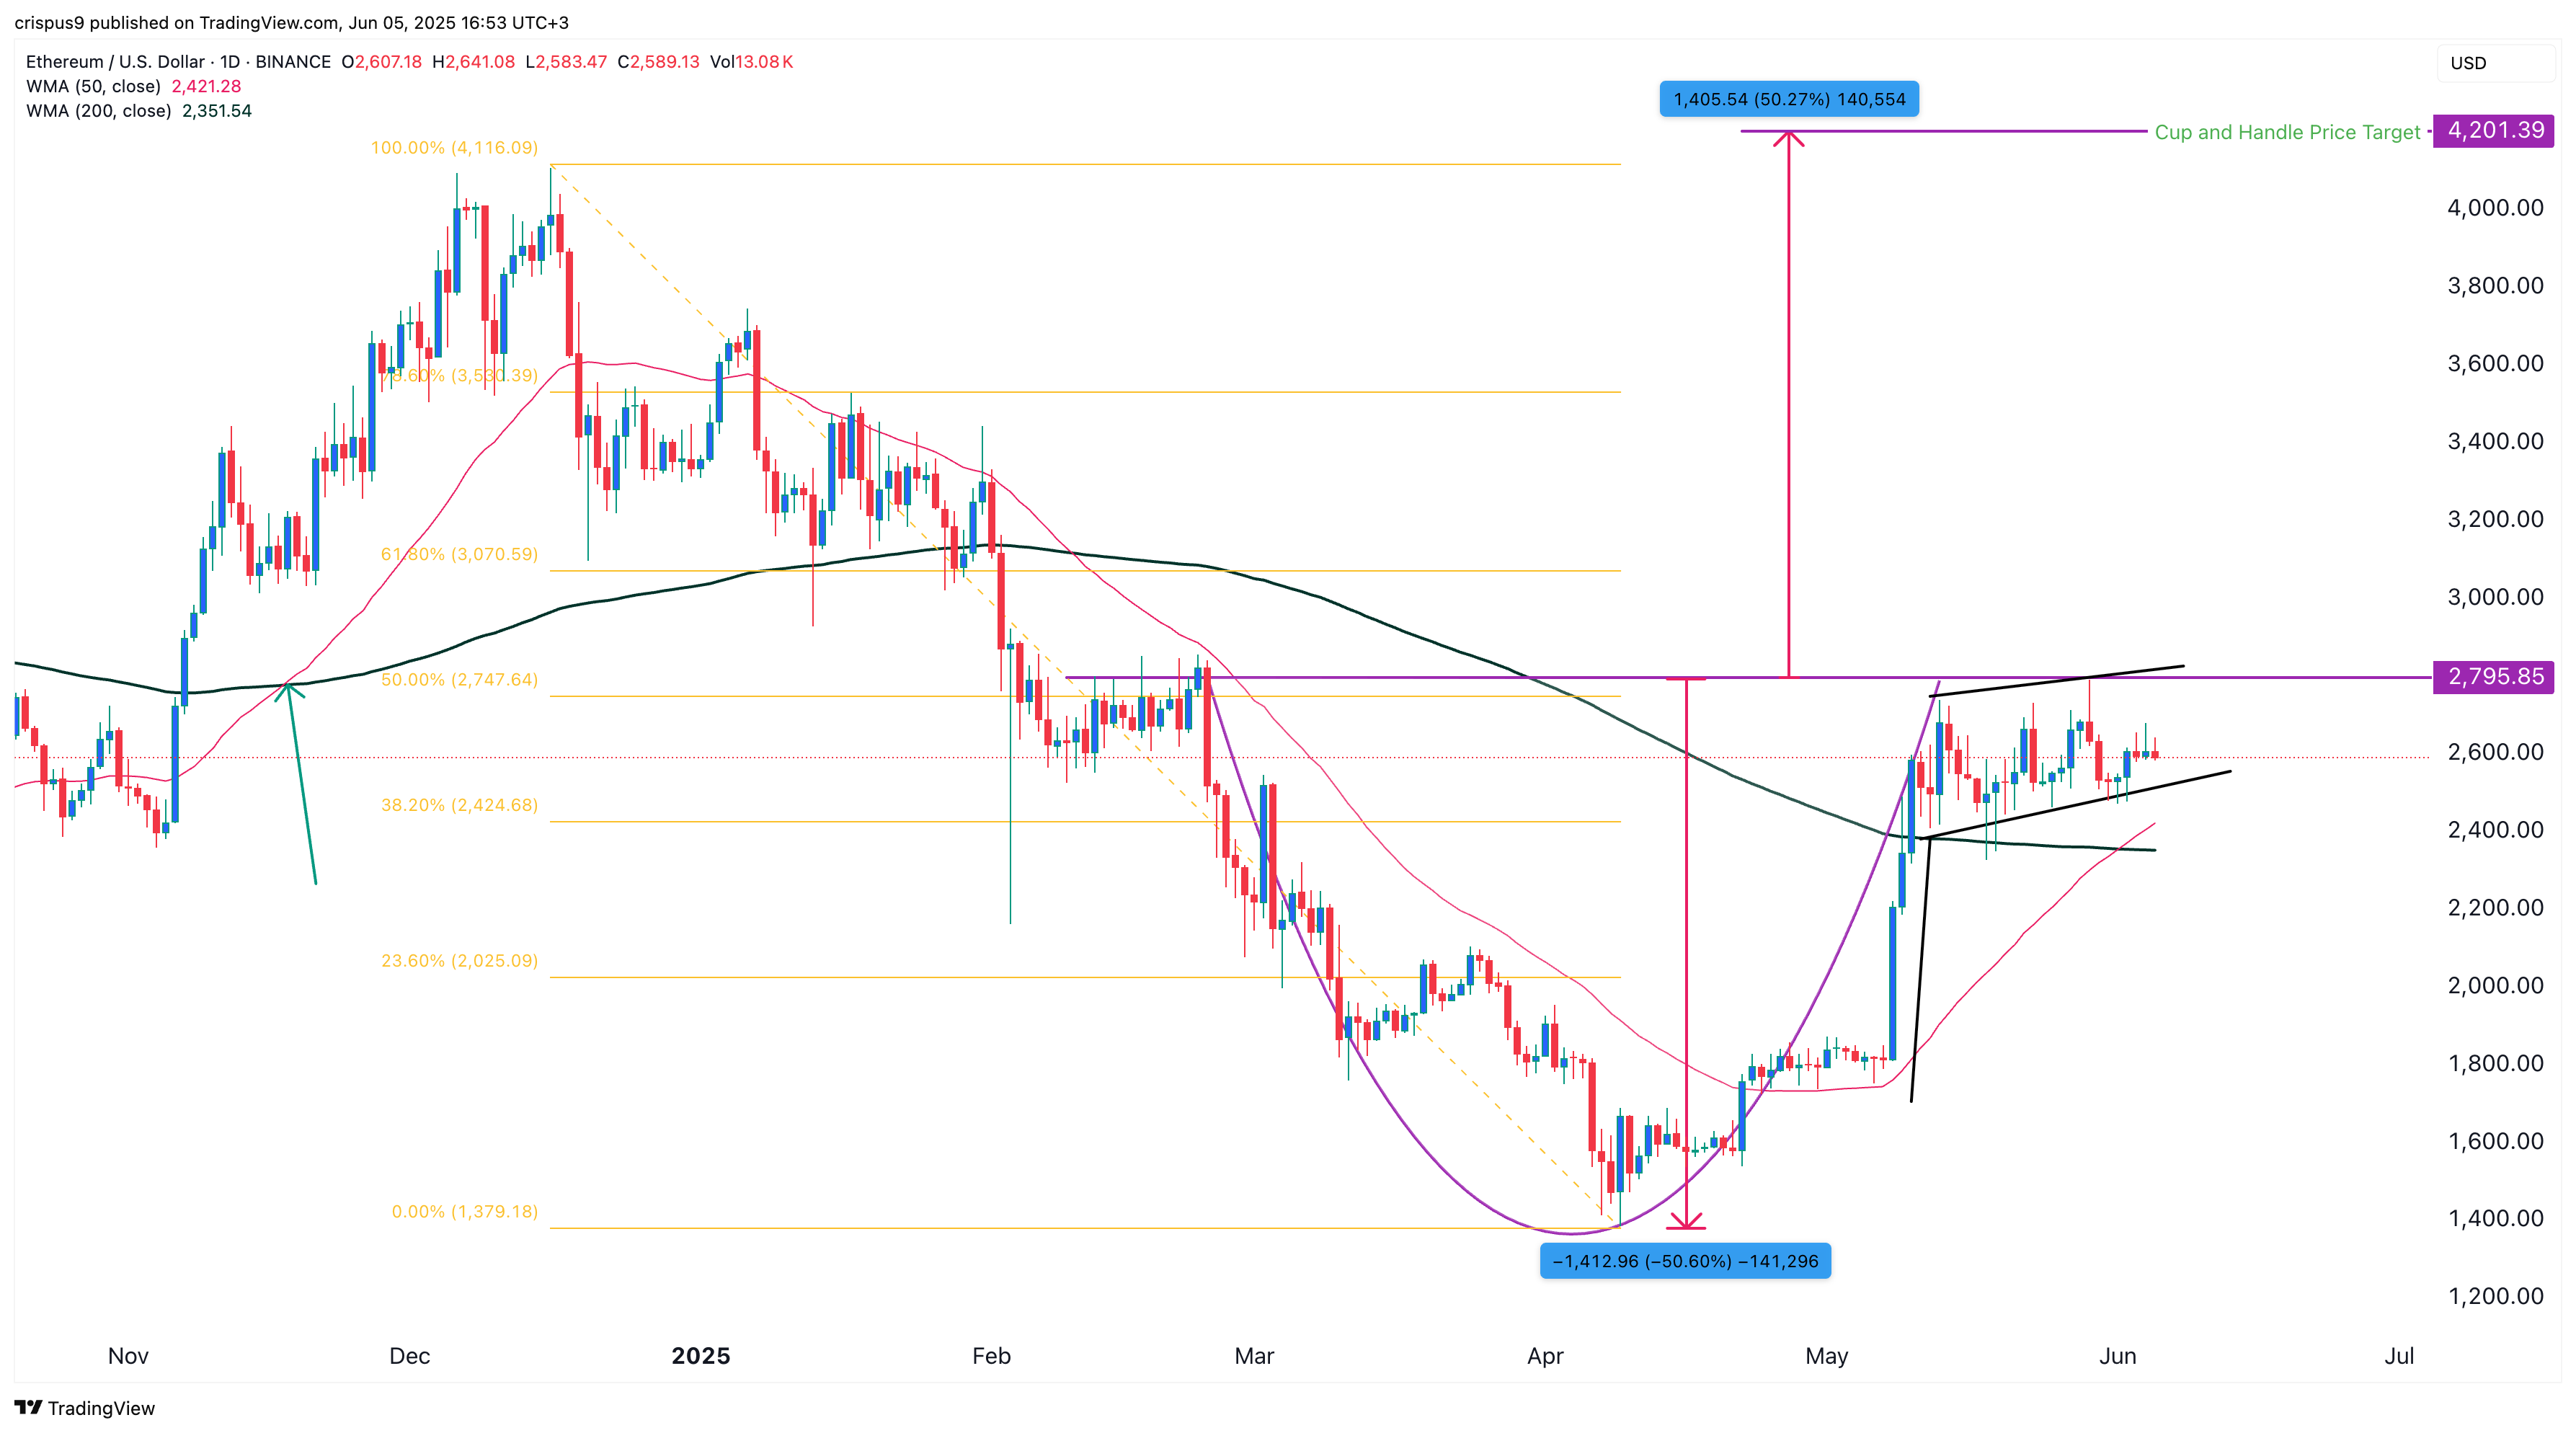
Bitcoin has also formed a cup-and-handle pattern, with the recent pullback forming the handle section. The cup features a depth of approximately 30%, or 34,000 points.
Using standard technical analysis, the target for a cup-and-handle breakout is calculated by adding the cup’s depth to its upper boundary. In this case, adding $38,000 to the top of the pattern yields a projected target of $146,000.
